Big Data Analytics and BI Solutions
Turn Complex Data into Scalable Business Intelligence
Our Big Data Analytics and BI Services help US startups and product companies transform fragmented data into secure, cloud-native analytics platforms that support real-time insights and growth.
- Modern data stack with Snowflake, BigQuery, Databricks
- Unified analytics across 20+ enterprise data sources
- High-performance data pipelines for real-time analytics

Get Your Free Consultation
Discuss your big data analytics and BI goals with our experts
Back
Whether you need help handling one specific part or your entire end-to-end flow, we can be your analytics partner!
Lead your Industry and make an Impact with Data
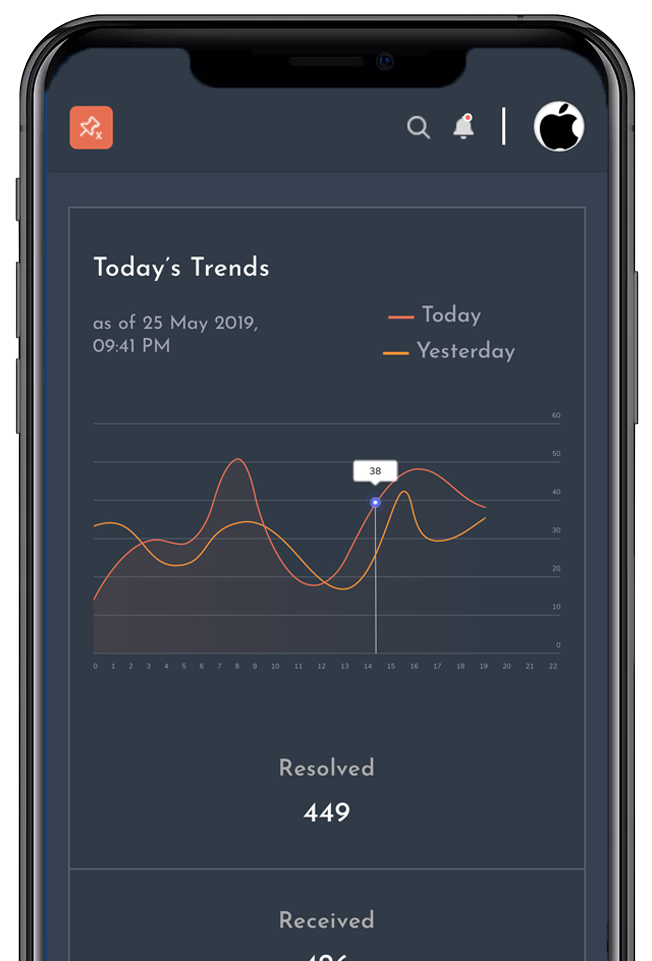
- Get Data In Real-Time To Make Faster Decisions
- Becoming A Real-Time Business And Grow With Data
- Grow Your Business With Analytical Insights
- Become “The New Agile” As Your DataOps Meets Self-Service
Jumpstart your project today the smart way
No matter where you are in the planning process of your app, our experts are happy to help you. Our expert consultants discuss your plans & challenges, evaluate your existing mobile apps or even make some initial recommendations.
Harness the Power of Data and Business Intelligence
We will analyze your needs and bring the best solution for you. With a robust data stack, you can gather the right
insights for your business. Our solution will provide you top capabilities in the following areas:
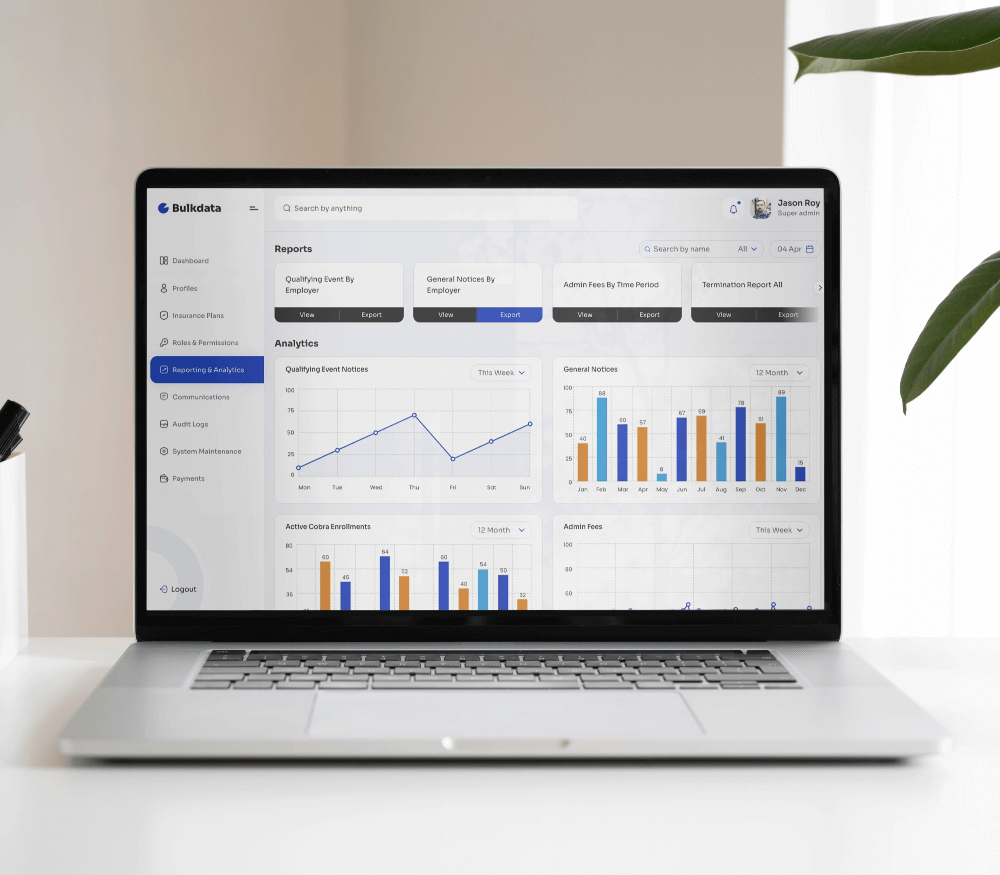
Reporting
We provide reports that objectively and accurately measure the health of our client’s businesses.
Research
Leverage our qualitative research to inform your strategy, identify your best target markets, and decide how to reach them.
Analysis
Get a comprehensive and detailed analysis with our slice and dice, drill-down, and deep visualization, mechanisms.
Testing
Ensure your best performance with A/B and multivariate testing.
Data Science
We will create data models for both prediction and prescription.
Visualization
Transform complex data into intuitive visualizations to gain insights.
Solving Traditional Data Access Challenges
Struggling with accessing data efficiently?
Our streamlined solutions, powered by advanced analytics technologies, remove complexities and empower you to make informed decisions, drive strategic initiatives, and achieve growth.

Data Analytics and Visualization Strategy
Our professionals have helped a broad range of industries and organizations by making them available with software solutions that are capable enough to take their businesses to reach the peak of achievements.
Product Engineering
Our clients stay ahead of the competition with our solutions and product delivery to the following industry standard best practices from ideation to product launch.
Optimize Your Data Access with a SQL Engine
Revolutionize your data access experience with the unparalleled efficiency of an SQL engine. Say goodbye to inefficiencies and hello to streamlined workflows. Access, analyze, and make informed decisions faster than ever before.
New Tagline for Project Here

What Bitcot can do for you?
As the need for gathering data becomes easier, companies now have to manage their data and provide a better way to uncover intelligent, actionable, and accessible insights from all their data sources.
Get You the Experts You Need
We have over ten years of experience in the industry. and our entire team, from our PM’s to our data scientists, is here for you to succeed!
Free Up Time to Grow Your Business
Liberate time for business growth. Partner with our team to reduce your workload while effectively expanding your business. Get in touch today.
Develop Your Big Picture Strategy
Leverage our wealth of experience in data, analytics, and insights to uncover and share best practices and effective strategies.
Analytics Packages
Explore our straightforward and comprehensive Analytics Packages to select the one that suits your business for immediate improvements today!
Take advantage of SQL engines and BI tools for optimal results.
Frequently Asked Questions
What is big data analytics?
Big data analytics is a strategy involving the process of collecting, organizing, and analyzing large amounts of data to assist businesses to make informed decisions.
What can analytics do for my business?
A great big data analytics strategy will uncover previously unknown patterns, correlations, preferences, and/or other vital information for your business.
Can data analytics be applied a business function other than marketing or support?
A data analytics strategy can be applied across all functions of a business to great effect.
What is data mining?
Data mining is the process of extracting useful patterns from a large amount of data. Data mining techniques are generally applied over a data warehouse system before business intelligence platforms further present or visualize the relevant data.
How do BI and analytics work together?
After collecting all necessary information, data analysis is done to discover key trends. After that, business intelligence platforms are used to demonstrate these trends and forecast future impact.
What is data monetization?
Data monetization is the process of using data to increase revenue. Top data analytics companies have integrated a data monetization plan into their overall strategy as a means to streamline current operations and identify new opportunities.