Key Takeaways
- Most digital product budgets capture Year 0 build costs only, ignoring three years of compounding operational spend.
- According to Flexera’s 2025 State of the Cloud Report, cloud waste consumes 27% of cloud spend on average.
- High technical debt environments consume 50 to 60% of engineering capacity, leaving almost nothing for feature development.
- According to ITIC’s 2024 Hourly Cost of Downtime Survey, over 90% of mid-size and large enterprises report downtime costs exceeding $300,000 per hour.
- AI integration without data readiness is one of the most expensive and under-scoped cost drivers in 2026, especially for SaaS platforms scaling in California and New York.
Introduction
The build was approved. Engineering shipped on time. And yet, 18 months later, infrastructure bills have tripled, the support team is drowning in legacy issues, and the product strains under twice the original user load. This is the total cost of ownership problem that never surfaces during the planning phase and it is not a finance issue. It is the delayed invoice from an architecture decision made 18 months ago.
Most technology leaders calculate TCO backwards. They anchor on build cost, then get blindsided by everything that follows. This guide is built for CTOs and technical leaders particularly those scaling products across competitive markets like San Diego, California, and New York who need a defensible framework for modeling the real cost of their digital products before the bill arrives. You will learn exactly how to structure a 3-year TCO model, identify the hidden cost categories that consistently kill roadmaps, and make architecture decisions with a full financial picture in hand.
Why Are Most TCO Calculations Dangerously Incomplete?
Most TCO frameworks were designed for hardware procurement, not living digital systems. Digital products behave differently: they grow under load, accumulate technical debt quietly, and break at the worst possible moments. The software lifecycle cost of a digital product is rarely what was scoped at kickoff.
According to Gartner’s research on software engineering, architecture decisions made at the MVP stage chosen for speed become the primary scalability bottleneck within 18 to 24 months. That pattern shows up consistently across SaaS, healthcare technology, and fintech platforms.
The gaps in typical TCO models fall into four areas:
- Strategic blind spot: Leadership approves a build budget without a parallel 3-year cost model. The roadmap and the cost projection live in different conversations.
- Technical limitations: Monolithic structures, tightly coupled services, under-provisioned databases, and brittle third-party integrations all compound in cost over time.
- Operational impact: According to ITIC’s 2024 Hourly Cost of Downtime Survey, over 90% of mid-size and large enterprises globally report downtime costs exceeding $300,000 per hour. A single incident in a poorly architected system can wipe out months of infrastructure savings in hours.
- Cloud waste: According to Flexera’s 2025 State of the Cloud Report, organizations waste an average of 27% of their cloud spend. Across a large cloud environment, that figure compounds into a significant annual loss.
What Does TCO Actually Cover for Digital Products?
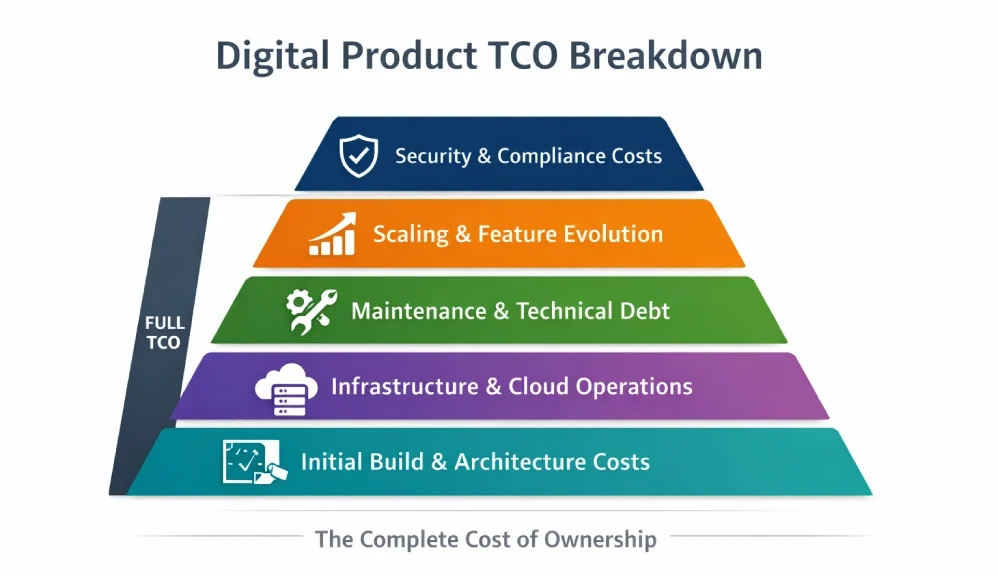
TCO for a digital product is not a single number. It is a multi-layer cost architecture spanning the entire product lifecycle. Here is how to think about it across five categories.
Initial Build and Architecture Costs
This is what most teams calculate: design, development, QA, DevOps setup, cloud configuration, and initial deployment. What they consistently miss is the cost premium embedded in architecture decisions made here. A poorly designed data model or a tightly coupled service layer does not reveal its true cost in Year 1. It surfaces in Year 2 and Year 3, when every feature request requires rearchitecting something foundational.
Infrastructure and Cloud Operations
This is where surprises begin. AWS, Azure, and GCP pricing models reward intentional architecture and penalize sprawl. Compute, storage, data transfer, managed services, CDN, observability tooling, and disaster recovery all accumulate fast. Infrastructure right-sizing after launch is not optional at scale it is a recurring operational discipline. Organizations that adopt a DevOps consulting approach alongside a FinOps framework consistently recover 20 to 30 percent of cloud spend within the first year through systematic resource governance.
Maintenance, Support, and Technical Debt Servicing
According to research published by McKinsey Digital on technical debt, companies spend 10 to 20 percent of their technology budget addressing technical debt each year, with high-debt environments consuming up to 40 percent of engineering capacity. For products built quickly for market validation, that figure climbs further. Every sprint spent servicing debt is a sprint not spent on revenue-generating features.
Scaling and Feature Evolution Costs
A product that cannot scale without full re-architecture is a liability, not an asset. When a SaaS platform needs to move from 10,000 to 500,000 users, or when an eCommerce platform needs to handle 10x traffic spikes, the cost of that scale depends entirely on decisions made during the original build. Cloud-native application development architectures scale incrementally. Monolithic, server-bound systems require expensive re-engineering at exactly the moment growth can least afford it.
Security and Governance Infrastructure
This category is consistently underestimated. For healthcare technology platforms and fintech products serving enterprise clients, security posture maintenance is an ongoing operational cost, not a one-time checkbox. Adopting a zero-trust security model at the architecture stage significantly reduces the cost of remediation later.

How to Calculate TCO for Your Digital Product: A Practical 6-Step Framework
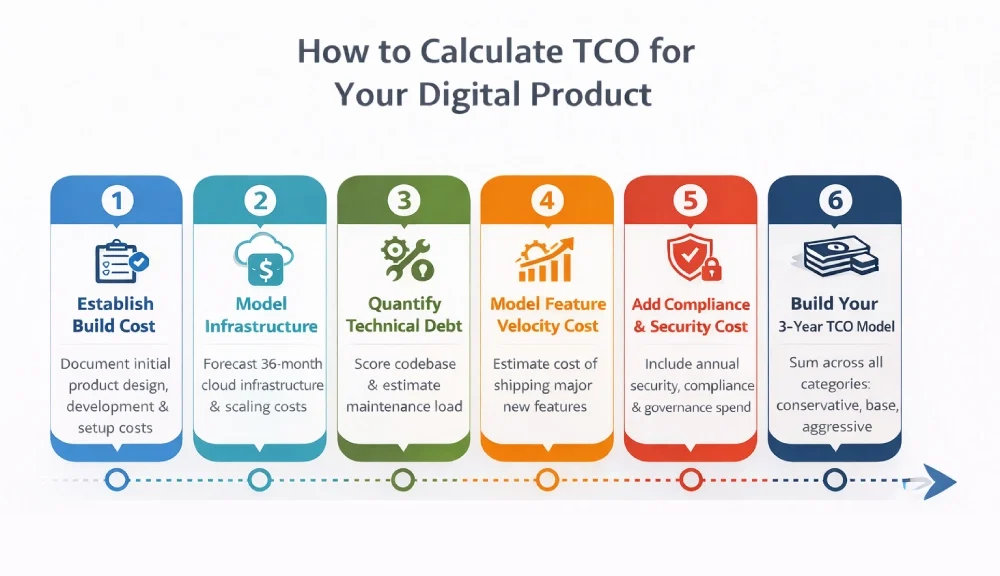
The goal here is not a perfect number. The goal is a defensible range that informs strategic decisions.
Step 1: Establish Your Baseline Build Cost
Document all Year 0 costs: product design, development (frontend, backend, mobile), QA, DevOps setup, third-party integrations, licensing, and initial cloud configuration. Do not confuse this with project budget. Include all soft costs: internal team time, stakeholder review cycles, and vendor selection effort. Accurate software development cost estimation is the foundation every TCO model is built on.
Step 2: Model Infrastructure Over 36 Months
Build a 3-year cloud cost projection. Work from your current architecture and map cost to anticipated growth scenarios at 2x, 5x, and 10x traffic and user load. Use cloud provider cost calculators, but layer in architectural overhead: load balancers, auto-scaling groups, database read replicas, CDN egress, logging infrastructure, and backup storage all scale with usage. Account for 15 to 25 percent year-over-year infrastructure cost growth for a scaling product.
Step 3: Quantify Your Technical Debt Load
Score your current codebase honestly using this framework:
- Low debt: Modern stack, modular architecture, good test coverage, clean CI/CD pipeline. Maintenance cost runs roughly 15 to 20 percent of annual development effort.
- Medium debt: Aging dependencies, partial test coverage, some tightly coupled services, manual deployment processes. Maintenance climbs to 30 to 40 percent.
- High debt: Legacy monolith, minimal documentation, no automated testing, brittle integrations. Maintenance can consume 50 to 60 percent of engineering capacity, leaving almost nothing for growth features.
Step 4: Model Feature Velocity Cost
What does it cost to ship a major feature today versus in a well-architected system? In high-debt environments, the hidden tax on every feature is real. If a feature that should take three weeks of engineering takes eight weeks because of architectural friction, that delta is a direct TCO input. Multiply that delta across your annual roadmap and you have a financial case for re-architecture investment. Engineering velocity is not just a productivity metric it is a cost metric with direct business implications. This is where legacy system modernization consistently delivers measurable returns.
Step 5: Add Security and Governance Costs
Model these as annual operational line items. Include security tooling (SIEM, vulnerability scanning, WAF), penetration testing, data governance tooling, and identity and access management infrastructure. Mature enterprise DevOps transformation embeds security into the delivery pipeline itself, converting what used to be a reactive cost into a predictable, manageable operational line item.
Step 6: Build Your 3-Year TCO Model
Sum across all five categories. Build three scenarios: conservative, base case, and aggressive growth. The result is not just a cost projection. It is a strategic decision-making instrument that tells you whether your current architecture can support your growth thesis, or whether you need to invest now before the cost of inaction compounds.
Legacy Architecture vs. Cloud-Native: The TCO Comparison Every Technical Leader Should Run
Before finalizing architecture strategy, run this comparison internally. According to McKinsey’s research on cloud adoption and IT modernization, cloud-native architectures consistently produce a lower 3-year TCO than maintained legacy infrastructure, with the gap widening as scale increases.
| Cost Category | Patchwork Legacy Architecture | Cloud-Native Architecture |
| Annual Infrastructure (at 5x scale) | Unoptimized sprawl, higher baseline | Right-sized, auto-scaling |
| Maintenance and Debt Servicing | 40 to 60% of engineering budget | 15 to 20% of engineering budget |
| Feature Velocity | 8 to 12 weeks per major feature | 3 to 4 weeks per major feature |
| Downtime Risk (annual hours) | 20 to 40+ hours | Under 4 hours |
| Security Posture | Reactive, audit-driven | Proactive, built into the pipeline |
| Scalability Ceiling | Requires re-architecture at 3 to 5x growth | Designed for 10 to 50x growth |
The numbers in this table are directional, not prescriptive. Every product, stack, and growth trajectory is different. But the delta between legacy maintenance and modern architecture investment is consistently significant across enterprise contexts.
What Are the Hidden Cost Categories That Kill Product Roadmaps?
Beyond the five foundational categories, several cost vectors consistently blindside technical leaders. These rarely appear in initial TCO estimates but materially impact total spend over a 3-year horizon.
Vendor Lock-In Premium
Choosing a platform that creates deep architectural dependency is a deferred cost. When that vendor changes pricing, deprecates a feature, or underperforms, migration cost enters the picture. Designing for portability at the architecture level, particularly for multi-tenant SaaS applications, is one of the most effective structural defenses against vendor lock-in inflating long-term TCO.
AI and ML Integration Overhead
As organizations explore AI-native product development, the data readiness gap is a significant cost driver. AI features built on top of unclean, unstructured, or siloed data require expensive preprocessing pipelines before they deliver value. The question “Is AI integration worth it without clean data?” has a clear answer: no, and discovering that mid-project is one of the most expensive lessons in 2026 product development.
Integration Complexity Tax
ERP, CRM, payment gateway, third-party API, and data warehouse integrations are routinely underscoped. An API-first architecture reduces long-term integration maintenance cost significantly, but only when planned from the start rather than retrofitted after launch. In healthcare technology, fintech, and manufacturing environments especially, integration complexity is frequently the primary source of project overruns. Budget integration costs at 20 to 30 percent of your core development estimate if your product operates within a complex technology ecosystem.
Technical Debt from Under-Resourced Builds
This is where legacy system modernization most often originates. Products built quickly under timeline pressure, with minimal architectural governance, become modernization projects within 24 to 36 months. The cost of that modernization almost always exceeds the original savings from cutting corners at build time.
Opportunity Cost
This is the hardest to quantify and the most expensive to ignore. Every month your team spends fighting infrastructure fires or servicing technical debt is a month not invested in features that drive competitive differentiation. According to research from Harvard Business Review on technical debt, organizations that proactively manage debt ship new features significantly faster than those that defer it. In high-velocity markets, that delay has direct revenue implications.
Build vs. Buy vs. Partner: Choosing the Model With the Best TCO Profile
A thorough build vs. buy analysis is one of the most consequential decisions in any digital product strategy. TCO analysis changes the framing of this question significantly.
| Factor | Build In-House | Buy / License | Senior Engineering Partner |
| Customization Flexibility | Full | Limited | Full |
| Time to Market | Slowest | Fastest | Fast |
| Technical Debt Risk | High if under-resourced | Low but lock-in risk | Low with proper governance |
| Architecture Ownership | Full | None | Shared |
| Scalability Control | Full | Vendor-dependent | Full |
| 3-Year TCO Profile | Highest if team is thin | Medium with licensing escalation | Lowest with right partner |
For technical leaders scaling products in the mid-market and enterprise range, the senior engineering partner model consistently delivers the strongest 3-year TCO when measured against outcomes: architecture quality, feature velocity, and infrastructure efficiency. The key variable is partner selection. A senior-only engineering team that leads with architecture strategy rather than hourly billing produces fundamentally different outcomes than a vendor optimizing for scope expansion.
What We’ve Seen Across Real Products
Across the healthcare technology and fintech products our team has built from San Diego, a pattern emerges consistently: the most expensive architecture is almost never the most complex one. It is the one built under deadline pressure without a clear owner for long-term system health.
We regularly see platforms where a data model that made sense for 500 users becomes the primary obstacle at 50,000 users. Or a third-party API integration scoped for three weeks of work that now consumes an engineer’s full sprint every month because no one planned for version drift. These are not edge cases. They are the default outcome when architecture decisions are made without a 3-year lens.
What we have learned is that the teams who avoid this pattern share one trait: they treat architecture as a living governance discipline, not a one-time deliverable. They review infrastructure utilization quarterly. They measure technical debt as a sprint metric, not just a feeling. And they make the build vs. partner decision based on where their internal team’s attention creates the most strategic leverage, not where it costs the least upfront.
“We rarely see a failing product. We see the decisions made two years earlier. TCO is not a financial model it is a reflection of every architecture choice your team made when the pressure was highest.”
— Raj Sanghvi, Founder & CEO, Bitcot

Conclusion
Every digital product has a true cost. The question is whether you discover it strategically or reactively. Technical leaders who treat TCO as a planning discipline make better architecture decisions, build more defensible board cases, and deliver more sustainable products at scale. The cost of building on the wrong architecture does not announce itself immediately. It accumulates, compounds, and by the time it is visible in your infrastructure bills and velocity metrics, correction is always more expensive than prevention would have been.
The companies scaling confidently in 2026 are not the ones that built cheapest or fastest. They are the ones that built with a clear 3-year cost model, an architecture designed for their growth trajectory, and governance systems that prevent the slow accumulation of technical debt from becoming a strategic crisis. Whether you are leading a digital transformation initiative, evaluating a re-architecture investment, or preparing a board-level cost analysis, the clarity you need starts with an honest TCO assessment. Your product’s next phase of growth is either being enabled or constrained by decisions already made in your architecture understanding your true TCO is how you find out which one.
Frequently Asked Questions
What is a realistic TCO for a mid-market SaaS product over 3 years?
For a mid-market SaaS platform serving 10,000 to 100,000 users, a well-managed 3-year TCO typically ranges from $900K to $2.5M+, depending on architecture quality, team structure, and growth rate. Products operating on legacy or high-debt architectures frequently see 3-year TCO that is 60 to 80 percent higher than cloud-native equivalents at equivalent scale.
How long does a TCO analysis or architecture review typically take?
A focused TCO and architecture assessment typically requires two to four weeks for a mid-market product. This includes infrastructure cost audit, technical debt scoring, growth scenario modeling, and 3-year cost projection. Larger or more complex environments may require six to eight weeks for a comprehensive review.
How do we account for integration complexity in our TCO model?
Third-party integrations, ERP connections, CRM syncs, payment processors, and data warehouse pipelines should be scoped individually and budgeted at 20 to 30 percent of core development cost. Integration maintenance should also be modeled as an ongoing annual cost, not a one-time line item. API deprecation, vendor updates, and schema changes create recurring integration maintenance obligations.
How do we prevent vendor lock-in from inflating long-term TCO?
Architecture portability is the primary mitigation strategy. This means favoring open standards, building abstraction layers between your core product and third-party services, using container-based deployment infrastructure, and maintaining database and infrastructure independence where possible. Lock-in becomes a TCO issue when migration cost or pricing leverage exceeds the value the vendor delivers.
What is the TCO impact of AI integration for digital products?
The TCO of AI integration is directly determined by your data readiness before a single model is deployed. AI integration without clean, structured data is one of the most expensive mistakes in current product development cycles. The model cannot save you from the data. If your data is siloed, unclean, or unstructured, AI feature costs balloon because significant engineering effort is required upstream before any model can deliver value. Data pipeline costs alone can consume 30 to 40 percent of an AI feature budget in low-maturity data environments. Cost-per-inference also scales rapidly without a deliberate model tiering strategy. A realistic AI integration TCO should include data pipeline development, model training and validation costs, inference infrastructure, ongoing model monitoring, and retraining cycles. For products with clean, structured data, AI features can be architected efficiently. For those without, the data readiness investment must be modeled first.
How do we manage security and compliance costs within TCO without overbuilding?
The key is layering compliance into the architecture from the start rather than retrofitting it during audits. For HIPAA, SOC 2, or PCI-DSS requirements, embedding security controls including a zero-trust security model at the infrastructure and application level during initial build is significantly less expensive than audit-driven remediation. Annual compliance operating costs should be modeled as a percentage of total engineering spend, typically 10 to 15 percent for regulated environments.
Can we work through a TCO assessment alongside our existing internal engineering team?
Yes, and this is often the most effective model. An external architecture review and TCO analysis complements rather than displaces an internal team. Your engineers have product and domain context. An external partner brings infrastructure cost benchmarks, architecture pattern experience, and a neutral lens on technical debt. You can learn more about how Bitcot structures this collaborative engagement model through our DevOps readiness approach. The combination produces more accurate TCO models and better architecture decisions than either can deliver independently.