Key Takeaways
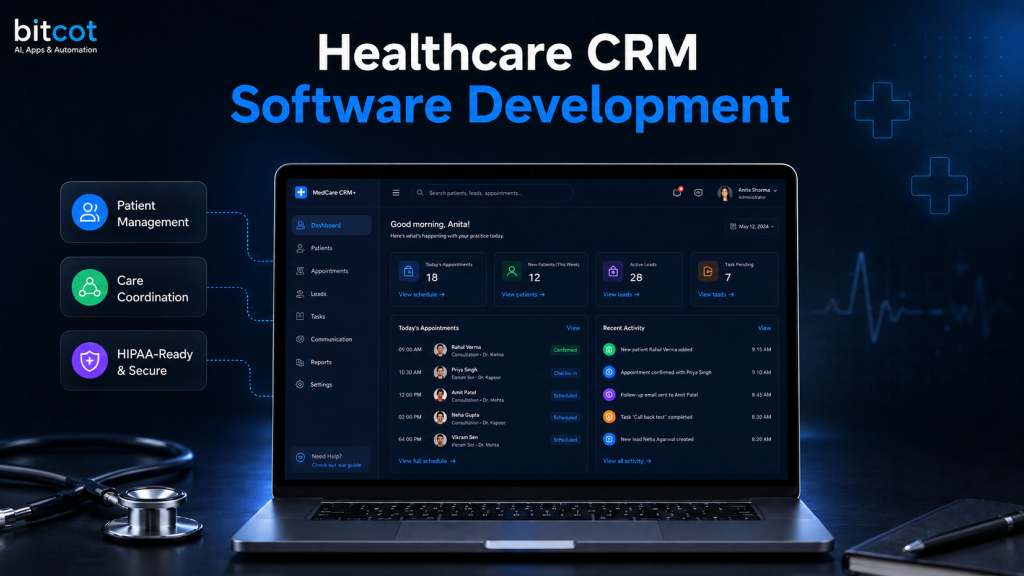
- LOIS (Lifecycle Operations and Individual Support) centralizes case management, regional center administration, service coordination, and access to individual care for people with Intellectual and Developmental Disabilities (IDD), eliminating fragmentation from siloed systems, paper-based records, and disconnected workflows.
- A five-role access architecture, DDS Administrator, Regional Center Administrator, Service Coordinator, Service Provider, and Individual/Family Member, ensures every user sees only the data and actions relevant to their function, while maintaining system-wide oversight at the top.
- Role-specific dashboards with live KPIs, caseload charts, IPP (Individual Program Plan) status tracking, health vitals monitoring, and appointment management give every stakeholder a contextualized, actionable view of their responsibilities.
- Service Providers get a dedicated clinical workspace, a real-time appointment schedule, patient health monitoring with vitals alerts, structured case notes with attachments, and a service analytics dashboard, making LOIS their single operational system rather than an administrative add-on.
- The Individual portal treats the person being served as an active participant in their own care, not a passive record: they can view their IPP, log health readings, request appointments, manage documents, and message their coordinator directly from a consumer-grade interface.
- Built-in messaging across all roles, combined with real-time alerts for overdue IPPs, missed appointments, pending service authorizations, and abnormal vitals, removes the communication gaps that typically delay care delivery for IDD populations.
Before examining what LOIS does, it is worth understanding why so many attempts at IDD case management software fall short. The patterns are consistent across organizations of all sizes:
Why IDD Case Management Platforms Fail
Flat role models that don’t reflect organizational reality. Many platforms treat all staff as equivalent users with minor permission differences. IDD service delivery has a genuine hierarchy: DDS sets policy, Regional Centers execute it, Service Coordinators manage individuals, and Providers deliver services. A flat user model creates information overload at every level and accountability gaps at every handoff.
Individual records that don’t travel with the person. When an individual transitions between Regional Centers, changes service providers, or ages from children’s services into adult services, their case history is frequently lost or manually reconstructed. Systems that store records by center rather than by individual create compounding coordination failures.
No structured IPP tracking. The Individual Program Plan is the legal and operational backbone of IDD service delivery. Most platforms treat it as a document attachment rather than a structured, date-tracked record with automated alerts for upcoming reviews and overdue completions.
Health monitoring is left to external systems. Service Providers caring for individuals with complex diagnoses need to track vitals alongside service delivery. When health data lives in a separate clinical system, the correlation between service quality and health outcomes is invisible to everyone responsible for the individual’s care.
The individual portal is treated as an afterthought. Most IDD platforms are built for staff. The individuals being served and their families often have no direct window into their own care plan, appointment schedule, web-based case management platform, or document library. This creates dependency on phone calls for information that should be self-service.
Appointment management is a standalone problem. Service coordination involves scheduling, confirming, and documenting dozens of appointments per individual per year. Platforms that lack a purpose-built software appointment layer force every role into a parallel calendar system that is never fully synchronized with the case record.
Reporting that requires data export. DDS and Regional Center leadership need real-time visibility into capacity utilization, case status distribution, and provider performance. Systems that require manual data exports ensure that leadership decisions are always made on stale data.
LOIS addresses each of these gaps through intentional product decisions at every layer of the architecture.
What Is LOIS and What Does It Do?
LOIS is a web-based case management platform purpose-built for the IDD service ecosystem. It supports five distinct user roles, each with a tailored dashboard and permission model:
| Role | Primary Function | Key Capabilities |
| DDS Administrator | System-wide oversight and policy enforcement | Regional center configuration, cross-center case visibility, user management, system-wide reporting, and analytics |
| Regional Center Administrator | Center-level operations management | Individual enrollment, service coordinator assignment, provider management, center-specific analytics |
| Service Coordinator | Individual caseload management | Case tracking, IPP management, appointment scheduling, alert management, inter-role messaging |
| Service Provider | Clinical service delivery and documentation | Appointment scheduling with real-time check-in, patient health monitoring with vitals alerts, structured case notes with attachments, service delivery analytics, and availability management |
| Individual / Family Member | Personal care management and active participation | Health monitoring with self-logged readings, IPP access and care plan review, appointment booking and virtual join, document management, and direct coordinator messaging |
Each role has a dedicated dashboard, navigation set, and data scope. No user sees more than their role requires, and no critical action is inaccessible to the role responsible for it.
In practice, a Regional Center managing 500+ active cases reduces administrative processing time by 40% through unified record access, while Service Coordinators track IPP compliance across their caseload in real-time rather than through monthly spreadsheet audits. Service Providers report 25% faster appointment scheduling and eliminate duplicate health documentation by accessing live vitals and structured case notes from a single clinical workspace.
How Is a Platform Like LOIS Architected?
Role-Centric Access Control
The foundational engineering decision in LOIS is that role membership determines every aspect of the user experience, not just permissions on individual records, but the entire navigation structure, dashboard layout, and available actions.
A DDS Administrator logging in sees a system-wide overview with regional center analytics and cross-center case metrics. A Service Provider logging in sees their daily appointment schedule, their patient health panel, and their case note queue, nothing more and nothing less than what they need to deliver services that day. An Individual logging in sees their own care plan, upcoming appointments, and health readings in a consumer-grade interface designed for accessibility.
This is implemented through a role-based routing layer that intercepts every authenticated session and maps the user’s role to a dedicated layout and navigation tree. The database enforces the same segmentation at the query level, ensuring that role separation is not just a UI concern but a data access guarantee.
Multi-Tier Organizational Hierarchy
LOIS models three tiers of organizational structure:
DDS is the state authority that oversees all Regional Centers. DDS Administrators have read and write access across all centers and all cases.
Regional Center Level: the operating organizations that serve specific geographic areas. Regional Center Administrators have full access within their center’s scope and read access to system-level configuration.
Individual Level: the case record itself, which belongs to the individual, not the center. This ensures portability when an individual transfers between centers or changes coordinators or providers.
This three-tier model requires careful schema design. The individuals table references the current Regional Center as a foreign key, but the full case history is preserved independent of center assignment. IPP records, service authorizations, health vitals, case notes, and appointment histories are all attached to the individual record, not the center record.
IPP as a First-Class Data Entity
The Individual Program Plan is not treated as a document attachment in LOIS. It is a structured data entity with fields for plan date, review due date, current status (Current, Due Soon, Overdue), associated goals, and linked service authorizations. This allows the platform to generate automated alerts when a review is approaching and to surface overdue IPPs as priority items in the coordinator, provider, and administrator dashboards simultaneously.
The IPP status is computed dynamically from the review due date, not manually set. This eliminates the most common failure mode in IPP tracking: records marked “Current” because no one updated the status after the review deadline passed.
Health Monitoring as a Native Layer
Rather than treating health vitals as external clinical data, LOIS integrates a health monitoring layer directly into the platform. Service Providers see blood pressure, heart rate, temperature, and oxygen saturation for every assigned individual in a single patient health table, with color-coded alerts for out-of-range readings. Individuals can log their own readings directly from their portal, creating a shared vitals record that both the provider and the individual contribute to.
How LOIS Unifies Fragmented Case Management Into One Accessible Platform
The engineering choices behind LOIS were made to support a multi-role, real-time, document-heavy platform with strict security requirements and a long operational lifespan. Every layer of the stack was selected with that context in mind.
Frontend
Core Platform and Framework
| Layer | Technology | Version |
| Runtime | Node.js | v20+ |
| Language | TypeScript | v5 |
| Framework | Next.js (App Router) | v16.1.1 |
| UI Library | React | v19.2.3 |
Next.js 16 with the App Router was chosen over a client-side SPA because the multi-role dashboard architecture benefits from server components’ administrative views with large data sets render faster when data fetching happens on the server, reducing the time-to-interactive for coordinators and administrators who open the platform at the start of each shift. React 19’s concurrent rendering improvements reduce UI blocking during heavy state updates, which matters in views like the Service Provider’s Patient Health Monitoring table, where multiple vitals rows update in real time.
State Management and Data Fetching
| Layer | Technology | Version |
| Global State | Redux Toolkit + React Redux | v2.8.2 / v9.2.0 |
| GraphQL Client | Apollo Client | v4.0.11 |
| GraphQL Queries | graphql-request | v7.4.0 |
| REST Client | Axios | v1.11.0 |
Redux Toolkit manages client-side state across the five role experiences: active user context, role-specific navigation state, selected filters, and notification feeds. The dual API client strategy (Apollo Client for GraphQL, Axios for REST) reflects the backend’s mixed API surface: core data operations (cases, individuals, IPPs, appointments) are served via GraphQL for flexible querying, while file operations, authentication callbacks, and third-party integrations use REST endpoints.
UI, Styling, and Component Architecture
| Layer | Technology | Version |
| Styling Engine | Tailwind CSS | v3.4.19 |
| Variant Management | class-variance-authority (CVA) | — |
| Icon Set | Lucide React | v0.562.0 |
Tailwind CSS enables the consistent design language across five distinct role interfaces without maintaining a large custom CSS codebase. CVA manages type-safe component variants the same Badge component renders green for “Active,” amber for “Due Soon,” and red for “Overdue” across every role’s dashboard without conditional class strings scattered throughout component trees. Lucide React provides a consistent icon vocabulary (calendar, person, bell, document, flag) that serves as visual anchors throughout the navigation and table action columns.
Specialized UX and Interactive Elements
| Layer | Technology | Version |
| Charts and Visualization | Recharts | v3.6.0 |
| Forms and Validation | simple-react-validator | v1.6.2 |
| Date Pickers | react-datepicker / react-day-picker | v9.1.0 / v9.13.0 |
| Toast Notifications | React Toastify | v11.0.5 |
| OTP Input | input-otp | v1.4.2 |
| Phone Input | react-phone-input-2 | v2.15.1 |
Recharts powers the data visualizations across the platform, the DDS administrator’s pie chart for Case Status Distribution, the Regional Center Admin’s bar chart for Active Cases by Coordinator, the Service Provider’s line charts for Individuals Served Over Time, and IPP Goal Achievement Rate. Two date picker libraries are used in combination: react-datepicker for single-date inputs (appointment scheduling, IPP review dates) and react-day-picker for range selections (report date filters, availability management). input-otp and react-phone-input-2 serve the authentication and profile flows, where OTP verification and international phone number formatting are required for the multi-organization user base.
Utilities and Developer Tooling
| Layer | Technology | Version |
| Date Utilities | date-fns | v4.1.0 |
| Date Formatting | moment | v2.30.1 |
| Cookie Management | js-cookie | v3.0.5 |
| Reactive Extensions | RxJS | v4.1.0 |
| Linting | ESLint v9 + eslint-config-next | — |
| Formatting | Prettier | — |
date-fns handles the computational date work, calculating IPP overdue status from review due dates, computing age from date of birth in the onboarding flow, and determining elapsed time for the “Last Reading” column in the health monitoring table. The moment is used for display formatting of dates in appointment cards and case note timestamps. RxJS manages asynchronous event streams for the real-time notification feed and the GraphQL subscription layer that pushes vitals alerts and IPP status changes to active sessions.
Backend
Core Platform and Framework
| Layer | Technology | Version |
| Runtime | Node.js | — |
| Language | TypeScript | — |
| Framework | NestJS | v11 |
NestJS was selected over Express or Fastify because the platform’s domain complexity, with five roles, 40+ object types, and strict security boundaries, benefits from NestJS’s opinionated module architecture. Each domain (Cases, Individuals, IPPs, Appointments, Health Monitoring, Regional Centers, Reporting) is implemented as a NestJS module with its own resolver, service, and repository layer. This structure makes the codebase navigable as the team scales and makes security boundaries explicit at the module level rather than scattered across middleware.
API Layer
| Layer | Technology | Details |
| API Protocol | GraphQL | — |
| GraphQL Server | Apollo Server + @nestjs/apollo | — |
| Schema Approach | @nestjs/graphql (Code First) | — |
| Real-time | graphql-subscriptions + graphql-ws | WebSocket transport |
GraphQL was chosen over REST as the primary API protocol because the five-role architecture creates highly variable data requirements across clients. A DDS Administrator’s dashboard query needs regional center aggregates, case counts, and user statistics in a single request. A Service Provider’s patient health table needs individual vitals with alert flags. A Service Coordinator’s case card needs IPP status, appointment dates, and provider names joined across multiple tables. GraphQL’s field selection prevents over-fetching across these divergent query shapes without requiring multiple REST endpoints per view.
GraphQL Subscriptions over WebSocket (via graphql-ws) power the real-time elements: vitals alerts pushed to the Service Provider’s patient health table when a reading exceeds range thresholds, IPP overdue notifications pushed to coordinator dashboards, and appointment status changes reflected in real time without polling.
Database and ORM
| Layer | Technology | Details |
| Database | PostgreSQL | pg driver |
| ORM | TypeORM + @nestjs/typeorm | Code-first entity definitions |
PostgreSQL was chosen for its row-level security capabilities, which enforce the platform’s data access model at the database layer, not just at the application layer. Row-level security policies ensure that a Service Provider’s query against the health_vitals table returns only readings for individuals enrolled in their programs, regardless of how the application query is constructed. TypeORM’s code-first entity definitions keep the database schema in sync with the TypeScript domain model through migrations, maintaining type safety from the API resolver down to the database row.
Cloud and AWS Integration
| Layer | Technology | Details |
| Authentication and Identity | AWS Cognito | @aws-sdk/client-cognito-identity-provider |
| File Storage | AWS S3 | @aws-sdk/client-s3 + @aws-sdk/s3-request-presigner |
AWS Cognito handles authentication and identity management across all five user roles. Cognito User Pools manage role assignment through custom attributes, and Cognito’s JWT tokens carry role claims that the NestJS authorization guards verify on every GraphQL resolver. This centralizes identity management outside the application database, which is the correct pattern for a multi-organization platform where DDS administrators, Regional Center staff, providers, and individuals may authenticate through different identity providers over time.
AWS S3 stores all documents in the platform IPP files, service plans, case note attachments, and individual-uploaded records. Presigned URLs (@aws-sdk/s3-request-presigner) allow the frontend to upload directly to S3 without routing file data through the NestJS application server, which keeps the backend stateless and avoids file size constraints on the API layer. The same presigned URL pattern controls document download access. A presigned URL expires after a configurable duration, ensuring that shared document links cannot be used after the intended access window.
Why This Stack for an IDD Platform
The combination of Next.js App Router on the frontend and NestJS on the backend creates a TypeScript-end-to-end architecture where the same type definitions describe the GraphQL schema, the API resolvers, the database entities, and the frontend component props. In a domain as compliance-sensitive as IDD service delivery, where a field label change in the UI must correspond to an accurate underlying data type, and where an overdue IPP must genuinely be overdue, not just displayed that way, end-to-end type safety is not an engineering preference. It is a correctness requirement.
AWS Cognito and S3 offload the two infrastructure concerns that have the highest compliance surface area, identity and document storage, to services with their own audit trails, encryption at rest, and regulatory certifications. The application layer handles domain logic; the cloud services handle compliance infrastructure.
How to Build an IDD Case Management Platform: Step-by-Step

Step 1: Define the Role Model and Permission Matrix
Before writing a line of application code, map the full matrix of roles, objects, and actions. For LOIS, this matrix covers approximately 40 object types: cases, individuals, IPPs, appointments, service authorizations, health readings, case notes, regional centers, users, messages, reports, and documents across five roles, with read, create, update, and delete permissions for each combination.
This matrix becomes the foundation for both the database row-level security policy and the frontend route guard implementation. Any shortcut here creates security debt that is expensive to fix after the data model is established.
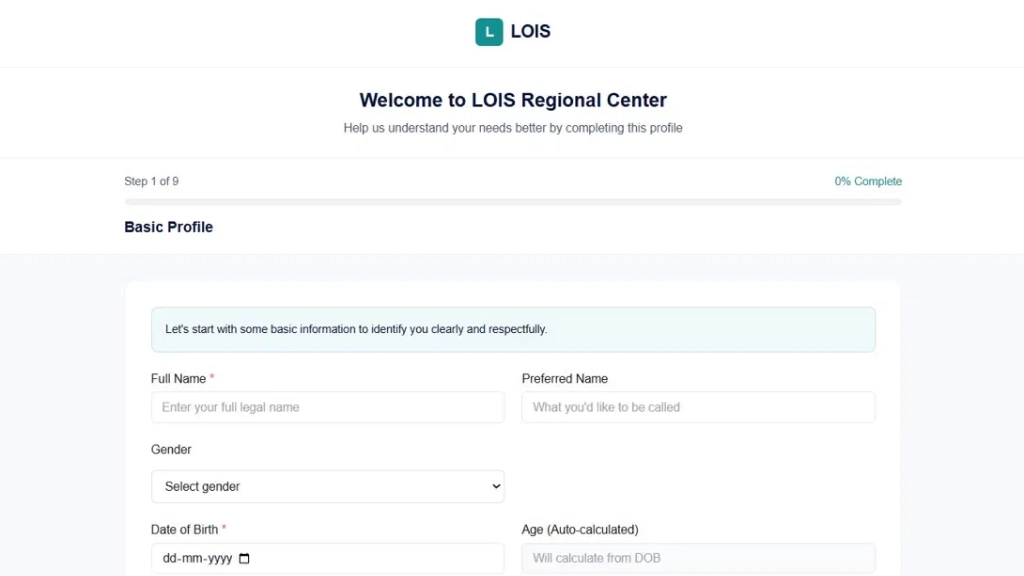
Step 2: Build the Individual Onboarding Flow
The individual onboarding flow is the most user-facing component of the entire platform and deserves disproportionate design attention. LOIS implements a nine-step progressive profile builder that collects:
Step 1 – Basic Profile: Full legal name, preferred name, gender, and date of birth with auto-calculated age. The “preferred name” field is a meaningful inclusion; it signals to the individual that the platform will address them the way they want to be addressed.
Step 2 – Contact Information: Primary address, phone, email, and preferred contact method.
Step 3 – Diagnosis and Medical History: Primary diagnosis, secondary diagnoses, and relevant medical history using structured dropdowns for diagnosis codes rather than free text, enabling downstream provider matching and reporting.
Step 4 – Support Needs: A structured assessment of support levels across daily living, communication, mobility, and behavioral support domains. This drives initial service recommendations and coordinator assignment logic.
Step 5 – Living Arrangements: Current living situation, primary caregiver, and housing stability indicators.
Step 6 – Emergency Contacts: Up to three emergency contacts with relationship, phone, and notification preferences.
Step 7 – Service History: Prior services received, prior regional center affiliation, and any existing provider relationships.
Step 8 – Goals and Preferences: Self-reported goals across employment, community participation, education, and personal development collected in the individual’s own words before the formal IPP is drafted, ensuring the plan reflects the person’s actual priorities.
Step 9 – Review and Submit: A summary view of all entered information with edit-in-place capability before final submission.
The persistent progress indicator (Step X of 9, percentage complete) reduces abandonment by making forward progress visible throughout.
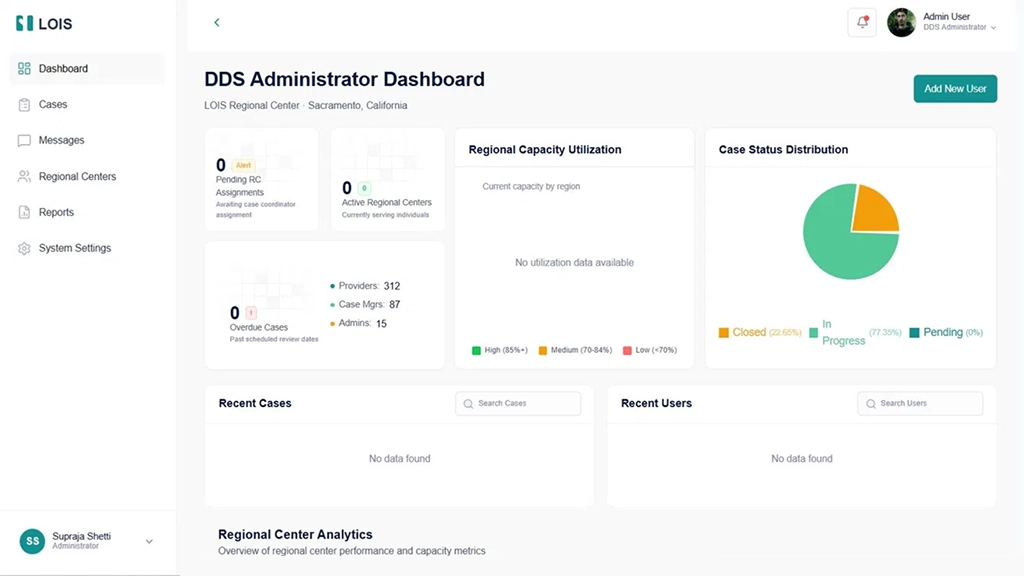
Step 3: Build the DDS Administrator Dashboard
The DDS Administrator Dashboard is the command center for system-wide oversight. It surfaces:
Summary KPIs: Pending Regional Center assignments awaiting case coordinator assignment, active Regional Centers currently serving individuals, overdue cases past scheduled review dates, and a breakdown of Providers, Case Managers, and Administrators across the system.
Regional Capacity Utilization: A map and chart view showing capacity utilization by region, segmented into High (85%+), Medium (70–84%), and Low (<70%) bands. This allows DDS administrators to identify under-resourced regions before they become crises.
Case Status Distribution: A pie chart showing the proportion of cases in Closed, In Progress, and Pending status system-wide, giving leadership an immediate read on system health without a report generation step.
Recent Cases and Users: Live-updating tables of recently created or modified cases and recently added users, with inline search. The “Add New User” action is surfaced prominently in the dashboard header.
Regional Center Analytics: A scrollable section showing per-center performance metrics, capacity rates, and coordinator utilization.
Step 4: Build the Cases Management Module
The Cases Management module is the operational core of the DDS Administrator experience:
All Cases table with pagination: The table displays Case #, Client Name, Case Status (color-coded badges), Assigned Regional Center (hyperlinked to center detail), Service Providers, Appointment Status, and Actions.
Multi-dimensional filtering: Status and Center filters combined with a search that queries case number, client name, and case notes simultaneously.
Flag system: Individual cases can be flagged for follow-up with a red flag icon, a lightweight prioritization mechanism that doesn’t require creating a formal task or alert.
Inline actions: View, Flag/Unflag, and Documents actions allow the most common case interactions without leaving the list view.
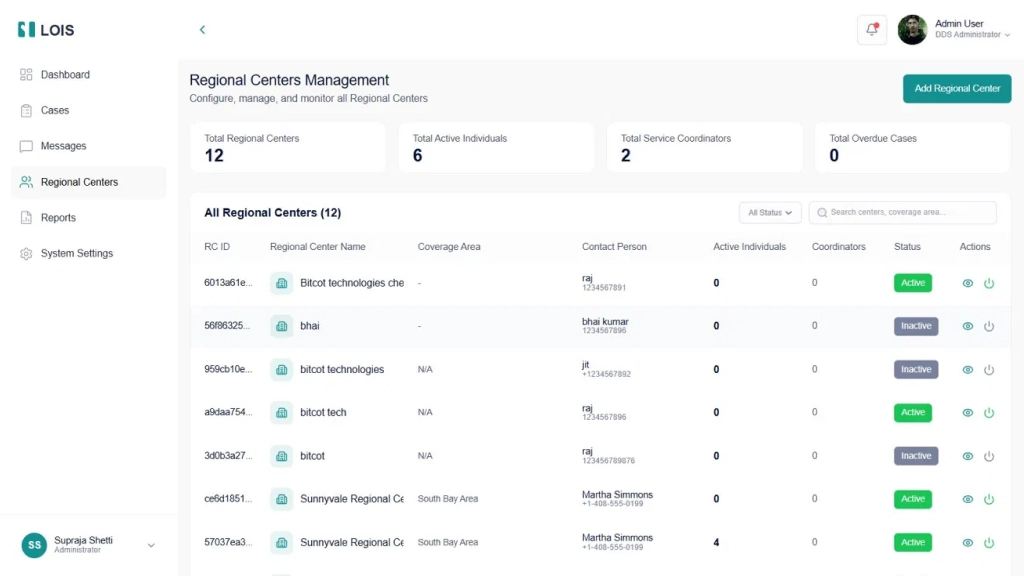
Step 5: Build the Regional Centers Management Module
The Regional Centers module gives DDS Administrators configuration and monitoring control over all centers. The summary bar shows Total Regional Centers, Total Active Individuals, Total Service Coordinators, and Total Overdue Cases at a glance.
The Add New Regional Center flow uses a three-tab progressive form: Basic Information (name, address, phone, email, leadership team), Coverage Areas (county and ZIP code selectors), and Assignment Rules (criteria for auto-assigning individuals to the center). The center list includes an Active/Inactive status toggle that disables a center without deleting it, preserving historical data while removing it from active assignment logic.
Step 6: Build the Regional Center Administrator Dashboard
The Regional Center Admin Dashboard operates at the center scope. Its primary panels are:
Active Cases by Coordinator: A bar chart showing active cases per Service Coordinator caseload imbalances is visible at a glance without drilling into individual records.
Case Status Distribution: A donut chart showing total cases broken down by Open, On Hold, and Closed, giving an immediate proportion read between active and closed cases.
Individuals Management: All enrolled individuals with diagnosis status, assigned coordinator (or “Unassigned”), IPP status with due date, active service count, and overall status. The “NEW” badge on recently onboarded individuals allows prioritized initial outreach.
Step 7: Build the Service Coordinators Module
The Service Coordinators module displays coordinator profiles as cards, a deliberate choice that foregrounds the human element of service coordination. Each card shows the coordinator’s name, role, Online/Offline status, Active Cases count, Performance percentage (derived from IPP completion rate, appointment attendance, and alert resolution time), upcoming appointments, email, join date, and direct actions to View Cases, Assign Individual, or open a message thread.
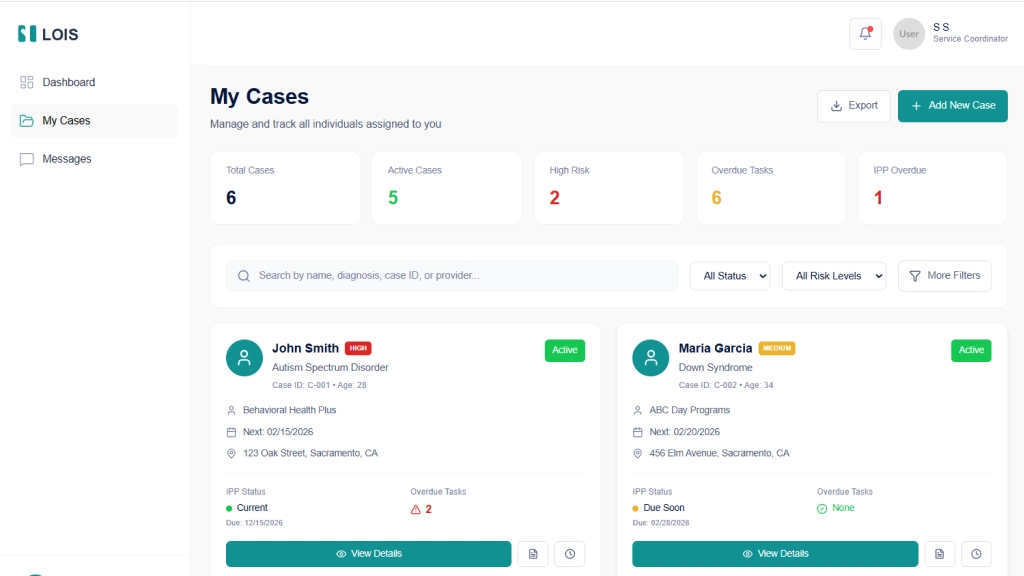
Step 8: Build the Service Coordinator Dashboard, and My Cases View
The Service Coordinator has a focused three-item navigation: Dashboard, My Cases, and Messages.
Dashboard KPIs: Total Individuals, Active Cases with risk distribution, Appointments Today (scheduled vs pending), and Urgent Actions requiring immediate attention.
My Active Cases: A card-grid view showing individual name, risk badge (HIGH, MEDIUM, LOW), diagnosis, case ID, age, service provider, next appointment, address, IPP status with due date, and overdue task count.
Today’s Appointments: A chronological list with client name, service type, modality (Virtual/In-person), and a “Join” button for virtual sessions.
Alerts & Follow-ups: A time-stamped feed of IPP Due Soon, Missed Appointment, and Service Authorization alerts the coordinator’s primary action queue.
Quick Actions: One-tap access to Add New Case and other high-frequency tasks from the dashboard sidebar.
Step 9: Build the Service Provider Experience
The Service Provider role is one of the most clinically rich experiences in LOIS, covering daily operations from the moment a provider starts their shift to the documentation completed after their last session.
Provider Dashboard
The dashboard greets the provider by organization name (e.g., “Welcome Back, Bright Futures Behavioral Services”) and surfaces three KPIs immediately: Today’s Appointments (5, up 1 from yesterday), Completed This Week (12, on track), and Active Individuals (25, up 3 this month). These delta indicators matter operationally; a provider seeing “+1 from yesterday” knows their schedule grew overnight without needing to cross-reference a calendar.
Today’s Schedule occupies the left-center panel, showing every appointment in chronological order with client name, service type (ABA Therapy Session, Behavioral Assessment), duration, location (Home Visit, Clinic), and real-time status. Three status states drive the interaction model: Completed sessions show a green checkmark; In Progress sessions show an amber badge and are actionable with a “Complete” button; Scheduled sessions show a teal “Check-In” button that the provider taps when they arrive. This real-time appointment lifecycle, Scheduled → Check-In → In Progress → Complete, creates the audit trail for service delivery documentation without requiring a separate system.
Manage Availability occupies the right panel, showing Today’s Hours (9:00 AM – 7:00 PM, AVAILABLE), upcoming approved time-off (with status badges like APPROVED), and two primary actions: Update Hours and Request Time-Off. Availability management directly integrated into the provider dashboard means coordinators and schedulers always see accurate availability when booking, eliminating the double-booking problem common to systems where provider calendars live externally.
Patient Health Monitoring
The Patients module is where LOIS most clearly differentiates itself from a generic scheduling platform. The Patient Health Monitoring view surfaces every assigned individual in a single table with five vital signs columns: Blood Pressure, Heart Rate, Temperature, Oxygen Saturation, and Alerts. Color coding is applied at the cell level, a blood pressure reading of 145/95 renders in red (hypertensive), while 118/76 renders in green (normal range). Heart rate values outside the normal band (e.g., 85 bpm for a given individual’s profile) render in amber.
The Alerts column shows a badge count of unresolved alerts per individual. A provider seeing “⚠ 1” next to an individual’s name knows immediately that something requires attention without opening the individual’s record. The Last Reading column shows elapsed time since the most recent vitals entry (15 mins ago, 1 hour ago, 2 hours ago), giving the provider an immediate sense of data currency across their entire caseload in a single view.
The View action navigates to the individual’s full health record, historical vitals trends, alert history, and links to related case notes and appointments.
Appointments Module
The Appointments module gives providers a full management view of their appointment schedule across all statuses. The summary bar shows Total Appointments (56), Completed (2), In Progress (1), Waiting (1), and Scheduled (51). The toggle between List View and Calendar View allows providers to switch between operational mode (what do I do next) and planning mode (what does my week look like).
Each appointment record in list view shows the individual’s name, patient ID, age, gender, appointment time, room, phone number, a Reason for Visit description, session notes, and a “View Report” link to the associated case note or outcome documentation. This inline note context means providers reviewing their schedule can see the substance of prior interactions – not just that a session happened, but what was discussed and what follow-up was indicated.
Case Notes Module
Case Notes in LOIS is a structured documentation system, not a freeform text field. Each note has a system-generated ID (CN-2026-001), a session type (Behavioral Therapy Session, Supported Living Services), the individual’s name and ID, date and time, service type, attachment count, and status (Completed, In Progress, Pending Review).
The summary bar shows Total Notes, Completed, In Progress, and Pending Review, giving supervisors a compliance monitoring view without needing to open individual records. Notes can have multiple attachments, supporting the documentation requirements of behavioral therapy, speech therapy, and supported living services. The search bar queries by individual name, ID, or note ID, and the status filter isolates notes needing attention.
The “Add New Note” button surfaces at the top right, keeping documentation creation accessible from the same screen where providers review their existing notes – avoiding the navigation friction that causes documentation to pile up until the end of the day rather than being completed session-by-session.
Service Reports and Analytics
The Reports module gives Service Providers data visibility over their own operational performance. Four top-line KPIs with month-over-month trend arrows show Active Individuals (+12%), Service Hours This Month (362 hours, +8%), IPP Goal Progress Rate (85%, +5%), and Session Completion Rate (97%, +2%).
Two line charts extend the view across six months: Individuals Served Over Time (monthly active caseload trend from August through January) and IPP Goal Achievement Rate (percentage of goals met or exceeded over the same period). These trend views allow providers to demonstrate clinical outcomes to Regional Centers and DDS administrators not anecdotally, but with a time-series record of goal achievement that is exportable via the “Export Report” button.
The date range selector (This Month default, with custom range option) means providers can generate period-specific reports for billing reconciliation, compliance audits, or program reviews without waiting for an administrator to pull data on their behalf.
Step 10: Build the Individual Portal
The Individual portal represents one of the most consequential design decisions in the entire platform: treating the person with IDD, and their family, as an active participant in care rather than a subject of care. Most IDD platforms are built exclusively for staff. LOIS builds an equal-quality experience for the individual themselves.
Individual Dashboard
The dashboard uses a horizontal top navigation (Dashboard, My Plan, Appointments, Documents, Messages, My Profile) rather than the sidebar pattern used by administrative roles. This layout choice reflects that the individual is a consumer of their care information, not an operator managing other people’s records. The top nav pattern is familiar from consumer health apps, reducing the learning curve for individuals and family members who may have limited technology experience.
Five Quick Action cards immediately visible on the dashboard surface the five most important self-service actions an individual or family member needs: Request Appointment (schedule a therapy or program session), View My IPP (access the Individual Program Plan), Message Service Coordinator (direct line to Sarah Johnson, their named coordinator), View Documents (assessments and reports), and Service Providers (view their support team). The personalization of “Contact Sarah Johnson” using the actual coordinator’s name rather than a generic label is a deliberate design choice that reinforces the human relationship rather than abstracting it.
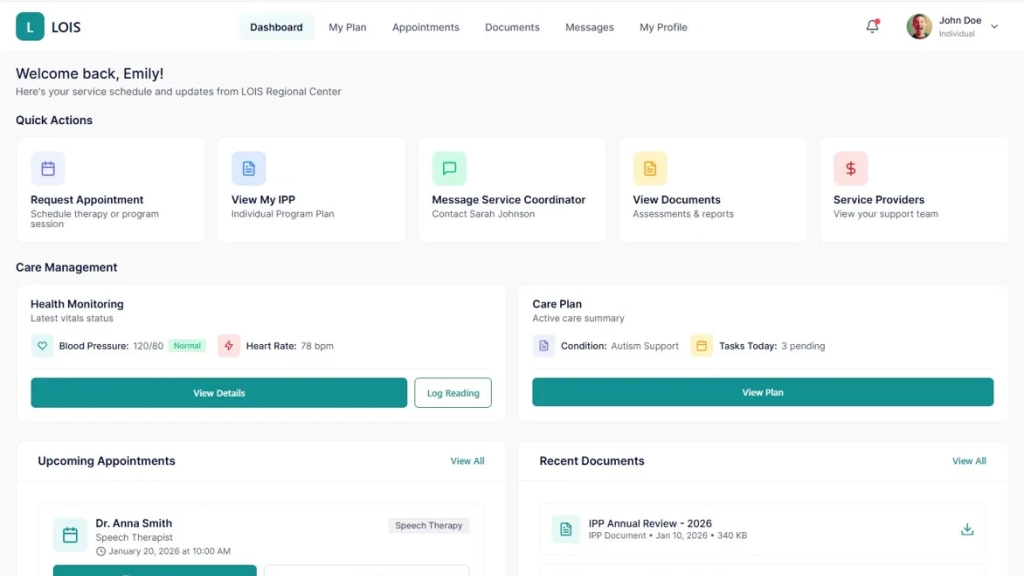
Care Management Panel
The Care Management section presents two side-by-side cards: Health Monitoring and Care Plan.
Health Monitoring shows the most recent vitals readings inline on the dashboard, Blood Pressure 120/80 with a “Normal” badge, Heart Rate 78 bpm with two actions: View Details (full vitals history and trend charts) and Log Reading (self-report a new reading). Putting vitals entry on the individual’s dashboard creates a shared health record that both the provider and the individual contribute to. An individual who logs their blood pressure at home between appointments is providing their care team with data that the clinical visit alone could never capture.
The Care Plan card shows an active condition (Autism Support), pending tasks for today (3 pending), and a “View Plan” button that opens the full IPP. Surfacing today’s task count directly on the dashboard creates gentle accountability, so the individual can see at a glance whether they have care-related actions pending without needing to navigate through multiple screens.
Upcoming Appointments
Below the Care Management cards, the dashboard shows the next scheduled appointment (Dr. Anna Smith, Speech Therapist, January 20, 2026, at 10:00 AM) with a prominent “Join Session” button for virtual appointments. The Reschedule option is available without requiring contact with the coordinator, reducing the coordination overhead for routine schedule changes.
Recent Documents
The Recent Documents panel shows the most recently updated care documents (IPP Annual Review 2026, Service Authorization Speech Therapy) with direct download links. Putting the document library on the dashboard homepage, not buried in a submenu, signals that these documents belong to the individual, not just to their care team.
My Appointments
The Appointments module gives individuals a self-service view of their complete healthcare appointment schedule across all providers and specialties, not just IDD services. The summary shows Total Appointments (10), Upcoming (7), and Completed (2).
The grid view (toggleable to Calendar View) shows each appointment as a card with provider name, specialty, date, time, modality (Virtual Consultation, OPD Consultation, Follow-up), room location, duration, and Reason for Visit. For each appointment, three actions are available: Join Meeting (for virtual sessions), View Details, Reschedule, and Cancel. The Reschedule and Cancel actions are available directly on the appointment card without coordinator intervention, giving individuals the autonomy to manage their own schedules.
The search bar queries by doctor name, specialty, or appointment ID. This is meaningful for individuals managing complex multi-specialty care, who may need to find a specific appointment among many without scrolling through the full list.
My Documents
The Documents module organizes the individual’s complete document library by type: Individual Program Plans, Service Plans, Assessments, and Reports. Each category is shown as a collapsible section with document count. Documents display file name, type, date, file size, status (Active, Reviewed), and expiration date, where applicable.
Two actions are available per document: View (inline document viewer) and Download. The Upload Document button at the top right allows individuals and family members to contribute their own documents, medical records from external providers, school assessments, and specialist reports to their LOIS record. This bidirectional document flow, where the individual can add to their own record rather than only receiving documents from providers and coordinators, is a meaningful capability that most IDD platforms don’t offer.
Step 11: Build the Messaging Module
The Messages module is implemented as a persistent sidebar-and-chat-pane layout, consistent across all administrative roles and available to individuals and service providers. Key elements:
Conversation list with search: Recent conversations are listed with contact name, role, and last message timestamp. A search bar filters across all contacts, enabling any user to start new conversations with anyone in their accessible contact list.
Contacts tab: Separate from Recent conversations, the Contacts tab surfaces all contactable individuals within the user’s organizational scope. For a Service Coordinator, this includes the individual’s family contacts and enrolled providers. For an Individual, this includes their named service coordinator, their providers, and their Regional Center contact.
Empty state design: The “Select a conversation” empty state with a clear call to action respects the user’s attention; it doesn’t fill space with noise when no conversation is active.
Key Product Decisions in Building LOIS
A common architectural shortcut in multi-role platforms is to build one navigation structure and hide/show items based on role. This creates interfaces where every user can see the menu items they don’t have access to, creating cognitive load and the perception of a restricted experience.
LOIS takes the more deliberate approach: each role has a completely independent navigation tree. A DDS Administrator’s sidebar shows Dashboard, Cases, Messages, Regional Centers, Reports, and System Settings. A Service Provider’s sidebar shows Dashboard, Patients, Appointments, Case Notes, Messages, and Reports. An Individual’s top nav shows Dashboard, My Plan, Appointments, Documents, Messages, and My Profile. These different structures immediately communicate that these are purpose-built tools for different jobs.
Why Health Monitoring Is Integrated, Not Bolted On
The decision to integrate vitals monitoring directly into LOIS rather than integrating with a separate clinical system via API was driven by the reality of how IDD service providers operate. Most Service Providers in the IDD ecosystem are not clinical facilities with dedicated EHR systems. They are behavioral therapy agencies, supported living organizations, and day programs. A standalone vitals panel that lives within their existing workflow is more likely to be used and kept current than an integration that requires them to context-switch to a clinical platform they may not otherwise use.
The individual-facing health monitoring layer extends this further. When an individual logs their blood pressure at home, that reading is immediately visible to their provider and their coordinator in the same platform they are already using for appointments and case notes. The data network effect, with multiple parties contributing to the same record, produces a more complete health picture than any single source could alone.
Why Individual-Centric (Not Center-Centric) Data Storage
Storing case history at the individual level rather than the center level is a foundational decision that most IDD platforms get wrong. When an individual transfers between Regional Centers, which happens regularly due to geographic moves, center capacity issues, or parental preference, their entire service history should transfer with them, not stay behind at the origin center.
This requires the case_history, ipp_records, health_vitals, service_authorizations, case_notes, and appointment_records tables to all reference individual_id, not regional_center_id. The current_regional_center foreign key on the individuals table updates on transfer, while all historical records remain intact.
Why the Individual Portal Has Its Own Design Language
The Individual portal uses a horizontal top navigation, card-based layout, and consumer-style interactions (Join Session, Book Appointment, Log Reading) rather than the sidebar-and-table layout used by administrative roles. This is not cosmetic differentiation; it reflects a fundamentally different relationship with the platform.
Administrative users are operators who manage records and take actions on behalf of others. Individuals are participants who access information about themselves and take actions on their own behalf. The design language should communicate this difference. An individual logging into LOIS should feel like they are opening their health portal, not logging into an administrative system where they happen to have an account.
Why IPP Status Is Computed, Not Manually Set
IPP compliance is one of the highest-stakes compliance obligations in IDD service delivery. A plan that is past its review date but marked “Current” in the system is both a regulatory risk and a care quality failure.
LOIS computes IPP status dynamically: if the review due date is more than 30 days away, status is “Current”; within 30 days, “Due Soon”; past due, “Overdue.” The color coding is consistent across every view in the system where IPP status appears on provider dashboards, coordinator case lists, administrator overviews, and the individual’s own My Plan view. No coordinator action is required to surface an overdue IPP; the system does it automatically.
Why Performance Metrics Are Outcome-Based
Service Coordinators often resist performance tracking because the wrong metrics create perverse incentives: case throughput metrics incentivize closing cases early; appointment completion metrics incentivize scheduling only easy-to-complete appointments.
LOIS defines coordinator performance around three outcome indicators: IPP currency rate, appointment completion rate, and alert resolution time. For Service Providers, the equivalent metrics are Session Completion Rate and IPP Goal Progress Rate, both visible in the provider’s own Reports module, creating self-aware quality measurement rather than externally imposed surveillance.
Common Mistakes When Building IDD Case Management Platforms
Treating IDD service coordination as a generic CRM problem. Off-the-shelf CRM platforms can manage contacts and tasks, but they have no concept of IPPs, service authorizations, regional center capacity, health vitals, or the regulatory obligations specific to IDD service delivery. Customizing a generic CRM to fit this domain typically costs more than building purpose-built software and produces a worse result.
Building the individual portal as a read-only view. A portal that lets individuals see their data but not contribute to it, no self-logged health readings, no appointment booking, no document uploads misses the therapeutic benefit of active participation. Individuals who can see and interact with their own care record demonstrate better care plan adherence and more effective communication with their coordination teams.
Separating health monitoring from service delivery. When vitals data lives in a clinical system, and service delivery data lives in a case management system, the correlation between health status and service quality is invisible. A provider who can see that an individual’s blood pressure spiked on a day when a session was recorded as “non-compliant” has clinical context that improves their response. A provider who needs to log into a second system to check the same data simply won’t.
Building reporting as a separate module. Reports that require a coordinator or administrator to navigate to a separate section, select parameters, and wait for generation will not be used for daily operational decisions. LOIS surfaces key metrics directly in each role’s dashboard and gives Service Providers their own analytics module so that performance data is visible without any deliberate reporting action.
Ignoring the unassigned case problem. Every IDD system accumulates unassigned cases of individuals enrolled in the system but not yet assigned to a Service Coordinator. LOIS surfaces unassigned cases prominently in both the DDS Administrator and Regional Center Administrator dashboards with a dedicated counter. Unassigned cases that are invisible in the dashboard are unassigned cases that go unaddressed.
Skipping the audit trail. IDD service delivery involves significant regulatory oversight. Every case note, status change, IPP update, service authorization decision, and vitals reading needs to be logged with a timestamp and user ID. Building the audit log as an afterthought typically requires a significant re-architecture. LOIS implements append-only event logging from the first sprint.
Underestimating accessibility requirements for the individual-facing experience. Individuals with IDD may have varying levels of digital literacy, may use assistive technology, and may be supported by family members with different technical comfort levels. The individual portal’s design, with large tap targets, plain language labels, and consumer-style interactions, reflects deliberate accessibility investment that generic admin interfaces do not provide.
Our Perspective on Building Platforms for IDD Service Organizations
Across healthcare and social services platform projects, a consistent pattern emerges: the organizations that serve the most vulnerable populations are often the ones with the least technical infrastructure. IDD Regional Centers frequently operate on legacy systems or manual processes, not because they lack awareness of better options, but because purpose-built software for their domain has been scarce, expensive, and poorly designed.
LOIS reflects a commitment to changing that. The teal-and-white design system communicates care and professionalism. The progressive onboarding flow treats individuals with dignity rather than reducing them to a case number. The provider portal gives clinical staff the operational tools they need without requiring them to also be power users of an administrative system. The individual portal treats the person being served as an intelligent adult who deserves access to their own information.
The most important technical decision in a project like this is also the least glamorous one: get the data model right before building any UI. An IPP is not a document. A regional center is not a user group. A service authorization is not a task. A vitals reading is not a case note. When the data model reflects the actual conceptual structure of IDD service delivery, every feature built on top of it is cleaner, more reliable, and easier to extend.
For organizations evaluating whether to build custom or buy, the honest answer is that the domain is too specific and the compliance requirements too particular for generic software to serve it well. The investment in purpose-built infrastructure pays back in coordinated efficiency, provider clinical quality, compliance posture, and most importantly, the quality of coordination and care that individuals with IDD receive every day.

Conclusion
LOIS demonstrates what a purpose-built IDD care management platform looks like when it is designed around how the entire ecosystem actually operates, not just the administrative staff, but the Regional Centers, Service Coordinators, Service Providers, and the individuals themselves.
The five-role architecture is not window dressing. It reflects the genuine operational differences between a DDS administrator managing regional capacity, a service coordinator balancing a caseload of forty individuals, a behavioral therapy provider documenting today’s ABA session, and a family member checking when their loved one’s next IPP review is scheduled. Each of these people uses the platform differently, needs different data, and takes different actions. A platform that treats them identically serves none of them well.
Building LOIS correctly required investing in the data model before the UI, integrating health monitoring as a first-class capability rather than a third-party add-on, building the individual portal with the same design care as the administrative experience, and designing each role’s experience as if it were the only product that role uses. Those decisions compound: a provider who trusts their appointment system documents better; an individual who can see their vitals trend is more engaged in their health; a coordinator whose alerts are accurate spends time on care instead of data hygiene.
If your organization is still managing IDD case coordination across spreadsheets, shared drives, and disconnected clinical and administrative systems, the infrastructure to do better exists. The question is whether the software you adopt is built for your domain or for someone else’s.
Frequently Asked Questions (FAQs)
What roles does LOIS support?
LOIS, a platform developed by Bitcot’s mobile app development team in San Diego, supports five distinct roles: DDS Administrator, Regional Center Administrator, Service Coordinator, Service Provider, and Individual/Family Member.
How does LOIS handle health monitoring?
Our San Diego-based development team integrates health monitoring layers in mobile apps like LOIS, allowing Service Providers to track vitals such as blood pressure, heart rate, temperature, and oxygen saturation efficiently.
What does the Individual portal allow?
The Individual portal empowers users and family members to:
- View and log health readings
- Access their Individual Program Plan (IPP)
- Request and join appointments, including virtual sessions
- Upload and manage documents
- Message service coordinators directly
Bitcot builds these portals with consumer-grade UX to increase engagement.
How does LOIS handle IPP tracking?
PP status is dynamically computed from review due dates. Coordinators, providers, and administrators see Due Soon and Overdue alerts automatically. This ensures compliance without manual tracking. Our team in San Diego implements automated workflow triggers as part of mobile app development
Can individuals transfer between Regional Centers without losing history?
Yes. LOIS stores case history, IPPs, health vitals, service authorizations, and appointment records at the individual level. Transfers between centers preserve the full history. Bitcot’s mobile app development expertise ensures data portability and integrity across user accounts.
How is Service Provider performance measured?
Performance is outcome-based with Session Completion Rate and IPP Goal Progress Rate, visible in the provider’s reports module. These metrics provide self-awareness rather than surveillance. Our San Diego developers integrate these dashboards seamlessly for mobile-first reporting.
How long does it take to build a platform like LOIS?
A full-featured IDD care management platform typically takes 24–32 weeks from discovery to production deployment. Bitcot’s experienced team accelerates development with proven frameworks and role-based architecture.
Can LOIS integrate with state DDS reporting systems?
Yes. LOIS supports structured exports compatible with state systems. Custom API development ensures seamless integration with systems like California DDS. Bitcot’s San Diego mobile app development team has implemented similar integrations for clients