LangSmith sits at the top of most shortlists, and it deserves to. It is also only one layer of a loop that has five other stages, and the stage most teams skip is the one that decides whether the agent gets better.
Key Takeaways
- Monitoring is not improvement. Traces show what happened. Evals show whether a change made the agent better, and most teams have far more of the first than the second.
- Naming failure modes is the step that decides everything else. Reading a hundred failed runs and grouping them into a named taxonomy turns “it feels worse lately” into a set of measurable, fixable problems.
- Gate releases on a score, not a demo. When a prompt change is tested in CI like a code change, every release carries a number and regressions stop shipping unnoticed.
- Standardize on instrumentation, stay flexible on vendors. In a market consolidating this fast, emitting OpenTelemetry spans makes switching platforms a configuration change instead of a quarter of rework.
Introduction
A regional medical equipment distributor put an order intake agent into production last spring. It read inbound purchase orders from email and fax, matched line items to catalog SKUs, checked contract pricing, and drafted the order in the ERP for a human to approve.
The demo was excellent. Six weeks in, approval rates were high and the operations team was happy. By month four they had quietly stopped trusting it. Approvers were opening every draft line by line again, which meant the agent had become a slower version of typing.
The engineering team had dashboards. They knew latency, token spend, and error rate. What they could not answer was the only question that mattered: when did it get worse, and which change caused it?
This is the most common failure pattern in production agent work, and it is not a tooling gap. LangChain’s State of Agent Engineering survey, run across roughly 1,300 practitioners at the end of 2025, found that observability adoption was running far ahead of evaluation adoption: close to nine in ten respondents had instrumented their agents, while only about half were running evals. Traces tell you what happened. Evals are what let you say a change made the system better.
This piece lays out the full loop, every category of tooling that can run it, and the honest tradeoffs. Some of it is opinionated. All of it comes from shipping agentic systems into environments where a wrong answer costs somebody money.
What continuous improvement actually means here
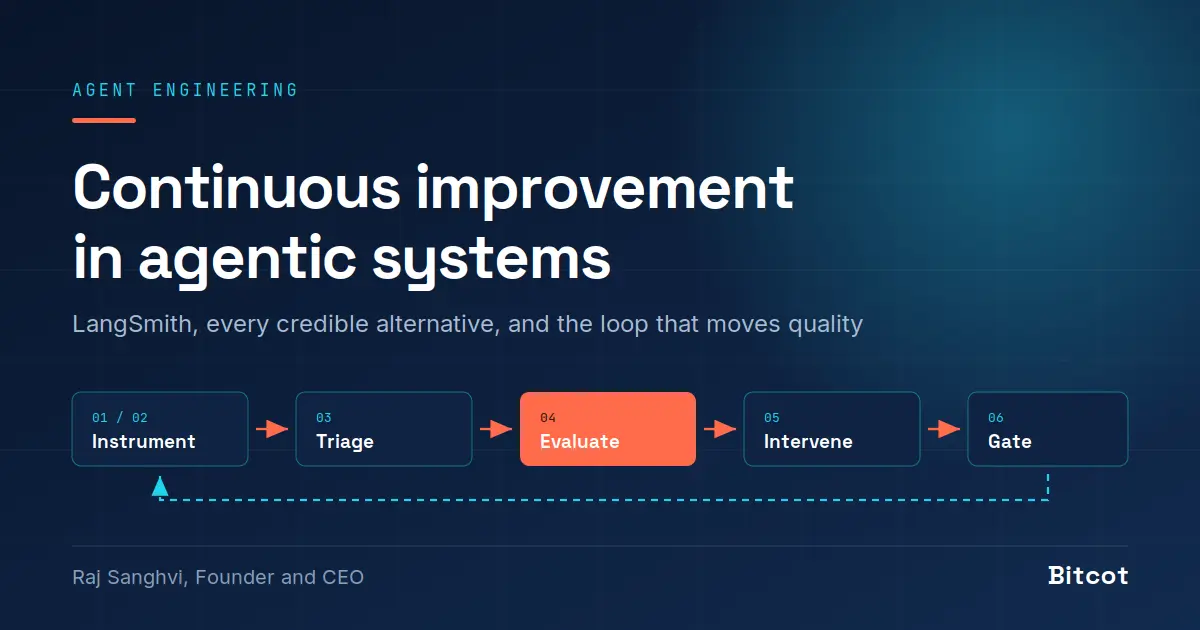
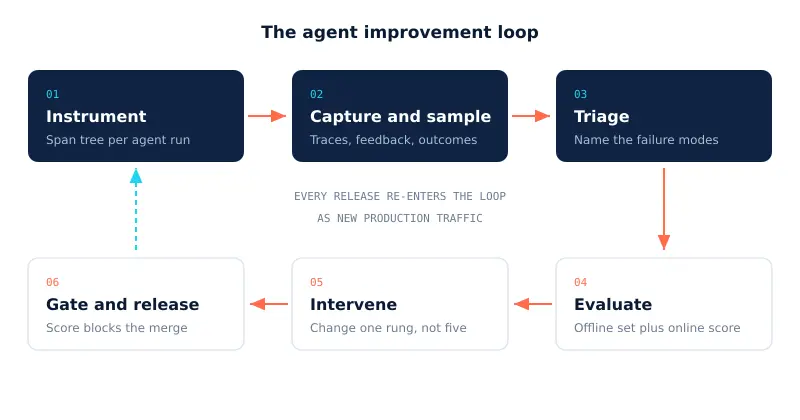
Continuous improvement in an agentic system is a closed loop that converts production behavior into measured quality changes. You instrument every run as a trace, sample and triage failures into a named taxonomy, turn those failures into evaluation cases, change one layer of the system, and gate the release on a score instead of a demo. Remove the evaluation step and what remains is monitoring, not improvement.
The distinction matters because the two get sold together and budgeted together. A dashboard showing p95 latency and cost per session is genuinely useful and completely silent on whether the agent picked the right SKU. Agent quality is a semantic property. It needs a semantic measurement, applied repeatedly, to the same inputs.
The loop has six stages. Teams that run all six improve predictably. Teams that run three of them improve by luck.
Agent runs fail in the middle, not at the edge. Tool call failures, context truncation, and unbounded retry loops are the dominant incident classes, and none of them surface as an application error.
Stage 1 and 2: instrumentation you will not have to rip out
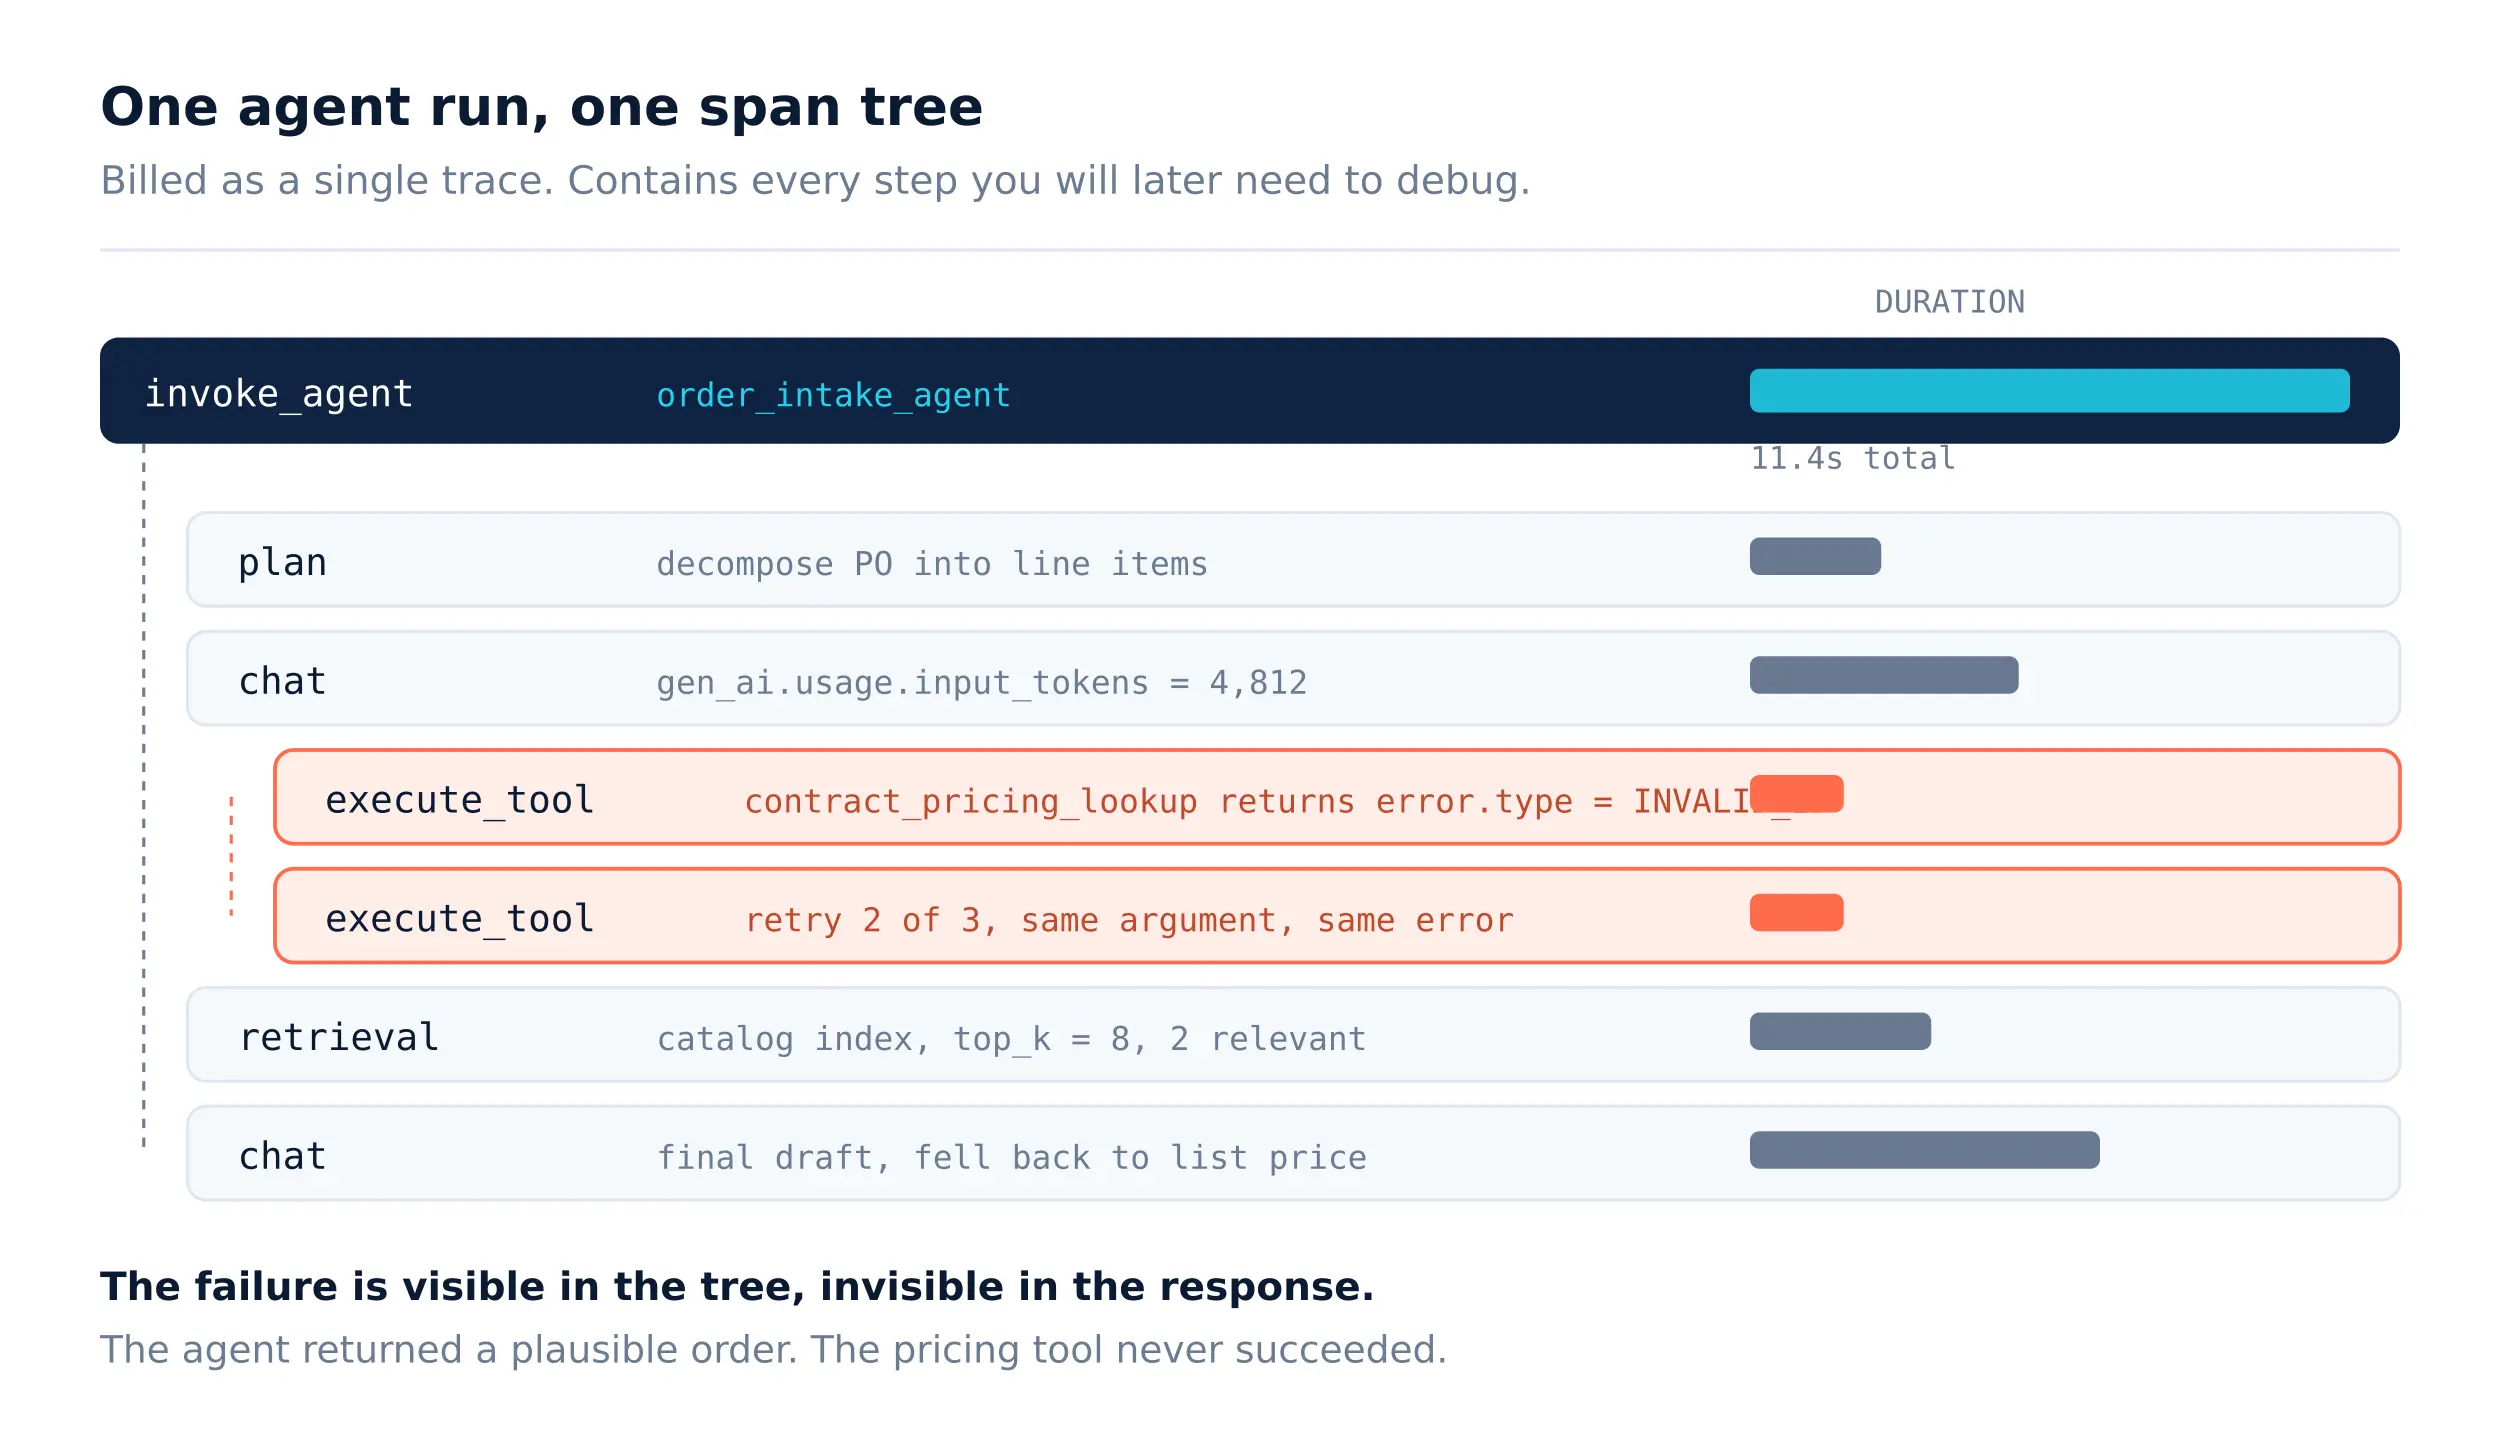
Standard application performance monitoring cannot see an agent. It sees an HTTP request that took eleven seconds and returned a 200. It cannot see that the agent called the pricing tool with a malformed contract ID, retried three times, silently fell back to list price, and answered confidently.
Agent-aware instrumentation means one span per meaningful step, arranged as a tree that mirrors the actual execution path. The OpenTelemetry GenAI semantic conventions now define exactly that shape. The vocabulary covers the full agent lifecycle, with operations for creating and invoking an agent, invoking a workflow, planning, model calls, retrieval, memory operations, and tool execution. As of mid-2026 the MCP conventions live in the same repository, so a Model Context Protocol tool call shares a trace vocabulary with the agent that issued it.
Agent runs fail in the middle, not at the edge. Tool call failures, context truncation, and unbounded retry loops are the dominant incident classes, and none of them surface as an application error.
The GenAI conventions are still marked Development rather than Stable, and through 2026 the project moved them into a dedicated repository that versions independently. That is not a reason to wait. It is a reason to pin your schema version, use the stability opt-in so you can dual-emit during a rename, and keep vendor-specific attributes in a clearly separated namespace. Prompt content and tool arguments are off by default in most instrumentation, which is the correct default for anything touching PHI or payment data. Turn capture on deliberately, per span type, with redaction in the pipeline rather than in the backend.
Sampling is a design decision, not a default
Two choices here shape everything downstream. First, what counts as a trace. One trace per session versus one per conversation turn is the same traffic priced several times apart, and it also changes what a regression looks like in your data. Second, what you keep. Head sampling throws away the failures you most need. Tail sampling, where you keep every run that errored, exceeded a latency budget, hit a retry ceiling, or received negative user feedback, plus a random slice of everything else, is the pattern that holds up at volume.
Capture outcomes too, not just traces. The approver clicking edit before submitting the ERP draft is the highest quality label your system will ever produce, and it is free. Wire that signal back into the trace as feedback on day one, not in month six when someone asks how you know it works.
Stage 3: error analysis is the stage everyone skips
Here is the uncomfortable part. Before any platform helps you, somebody on your team has to read traces. Not skim a dashboard. Read a hundred failed runs end to end, write a one-line description of what went wrong in each, then group those descriptions into a taxonomy with names.
For the distributor’s order agent, that exercise produced seven named failure modes in an afternoon:
- Unit-of-measure mismatch. Catalog in boxes, purchase order in each.
- Contract ID normalization. Customer writes it with dashes, tool expects without, retry loop with identical arguments.
- Substitution overreach. Discontinued SKU replaced with a similar item nobody authorized.
- Backorder silence. Partially available lines drafted as fully available.
- Multi-page fax truncation. Page two never reached context.
- Freight terms dropped. Present in the email body, absent from the draft.
- Confident list pricing. Pricing tool failed, agent answered anyway.
Those seven names are the most valuable artifact in the whole program. Every one becomes an evaluation case. Every one becomes a metric you can chart over time. Every one gives a product owner language for a conversation that used to be “it feels worse lately.”
Tooling accelerates this without replacing it. Several platforms now cluster traces automatically into recurring behaviors, which turns ten thousand events into a short list of things your agent actually does. LangSmith ships unsupervised topic clustering and error grouping in its insights layer. Laminar built its product around online clustering of extracted signal events. Arize Phoenix has embedding-based clustering and drift detection from its ML monitoring lineage. Use them to find candidate clusters faster. Do not use them to avoid naming the clusters yourself, because the name is where the domain knowledge enters the system.
Stage 4: three layers of evaluation, not one
Agent evaluation is not a single score. Scoring only the final answer tells you an order draft was wrong without telling you that retrieval returned the right catalog page and the model ignored it. Three layers, each answering a different question.
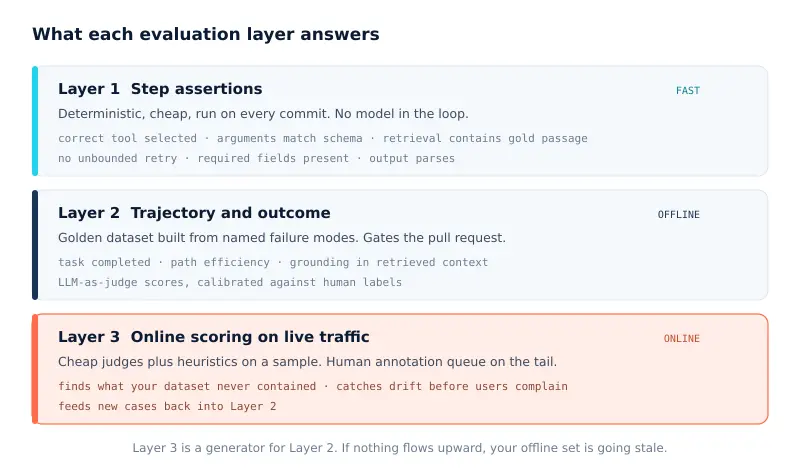
Offline evaluation prevents the regressions you have already named. Online evaluation finds the ones you have not. Neither substitutes for the other.
The judge needs evaluating too
LLM-as-judge is load bearing in every serious agent program, and it is routinely deployed unvalidated. A judge is a classifier. Treat it like one. Label a few hundred examples by hand, measure agreement between your judge and those labels, and report the agreement number alongside the eval score. If a judge agrees with your domain expert seventy percent of the time, a three point movement in your eval score means nothing at all.
Two things reliably improve judge quality: binary or low-cardinality rubrics rather than one-to-five scales, and per-failure-mode judges rather than one judge asked to assess overall quality. “Did this draft carry the correct unit of measure?” is a question a small model answers reliably and cheaply. “Is this a good order draft?” is not.
Regression gates in CI
The part teams underrate before adopting and lean on hardest after: wiring evals into continuous integration so a pull request that drops the score below threshold does not merge. LangSmith integrates with pytest, Vitest, and GitHub workflows for exactly this. Braintrust is built around the same loop. promptfoo, DeepEval, and Inspect AI give you the same gate with no platform at all, as a test suite in your repository.
Once a prompt change is gated like a code change, the nineteen-changes-in-four-months problem stops happening. Not because the team ships less, but because each change carries a number.
Stage 5: what you actually change
An eval score tells you the system is worse. It does not tell you which layer to touch. Teams burn quarters here, usually by reaching for the most expensive intervention first because it feels like the most serious one.
Work up a ladder, cheapest and most reversible first. Change one rung at a time, and re-run the same evaluation set after each change. That discipline is the entire difference between a system that compounds and a system that oscillates.
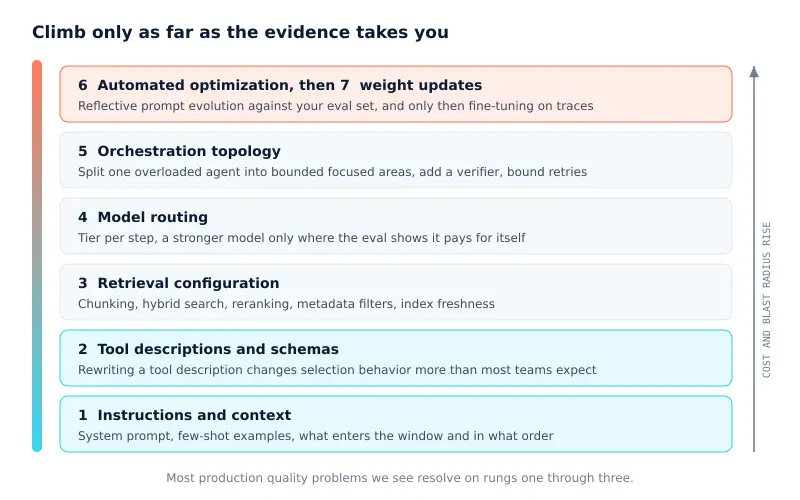
The ladder is ordered by cost and blast radius. Teams that start at the top usually cannot tell afterward whether it helped.
Rungs one and two do most of the work
The contract ID retry loop in the distributor case was a rung two fix. The tool accepted a normalized identifier, the description did not say so, and the model had no way to learn that from three identical failures. Adding the format to the tool description and making the tool normalize defensively removed an entire failure class. There is an active research line on exactly this, rewriting tool descriptions and instructions so agents select and call tools more reliably, and the practical version of it is a Tuesday afternoon.
Rung five is architectural
When one agent carries too many responsibilities, no prompt edit rescues it. The fix is structural: split the work into bounded domains, each with its own scoped facts, scoped documents, scoped actions, and its own evaluation set. A bounded domain is testable. A general assistant is not. This is the core of how we structure agentic systems at Bitcot, and it is the reason our evaluation sets stay meaningful as scope grows.
Rungs six and seven, honestly
Automated prompt optimization has become genuinely useful. GEPA, presented at ICLR 2026 and built on DSPy, runs your system on a minibatch, reads the execution traces and a textual feedback signal, and evolves prompt candidates along a Pareto frontier instead of using policy gradients. The published results report outperforming the GRPO reinforcement learning baseline by up to twenty percent while using far fewer model rollouts, and it has since been applied across a wide range of domains including clinical text and code generation.
An optimizer maximizes exactly the metric you hand it. Point one at a weak evaluation set and it will find the shortest path to a high score on a measurement that does not reflect your business. Every team that gets value from automated optimization built the evaluation set first. This is the single most common reason a promising optimization experiment produces a prompt that scores better and performs worse.
Fine-tuning and reinforcement learning on collected traces sit at the top for a reason. They are the most expensive to run, the slowest to iterate, and the hardest to reverse when the underlying model is deprecated. They are the right answer for narrow, high-volume, stable subtasks where you have thousands of verified examples. They are almost never the right first answer.
Stage 6: gate, release, and watch
The release mechanics are ordinary software engineering applied to a non-deterministic system:
- Version everything that shapes behavior. Prompts, tool schemas, retrieval config, and model identifiers belong under version control with the code, not in a console someone edits live.
- Gate the merge on the eval score, with an explicit threshold and an explicit owner who can override it in writing.
- Shadow before canary for changes to tools with write access. Run the new version against live inputs, compare to the current version, write nothing.
- Canary with online evaluation attached, so the rollout decision reads a quality signal rather than an error rate.
- Keep the failure taxonomy as a live dashboard. Seven named metrics beat one aggregate quality score, because only the named ones tell you what to do next.
And then the loop closes. New traffic, new traces, new clusters, new cases in the set.
The options: LangSmith first, then everything else
Now the tooling question. The category has more credible entrants than it did eighteen months ago and fewer independent companies, which is a combination worth understanding before you sign anything.
LangSmith
LangSmith is the observability and evaluation platform from the LangChain team, and it is the default tracing and evaluation backend if you build on LangChain or LangGraph. It is framework agnostic in practice, with SDKs across several languages and OpenTelemetry ingest, so teams on the OpenAI SDK, the Anthropic SDK, the Vercel AI SDK, LlamaIndex, or custom loops use it too.
What makes it the strongest single-vendor answer for the full loop:
- It covers all six stages in one place. Tracing with thread-level grouping, dataset collection from production traces, offline experiments with side-by-side comparison and regression flags, online LLM-as-judge and heuristic scoring on live traffic, human annotation queues, and alerting.
- CI gating is first class. pytest, Vitest, and GitHub workflow integrations mean an eval score blocks a merge the way a unit test does.
- Failure clustering. The insights layer performs unsupervised topic clustering and error analysis over traces, which cuts the manual triage pass down considerably once you know what you are looking for.
- It kept expanding through 2026. A unified cost view spanning retrieval, tool execution, and downstream API spend rather than model calls alone; a purpose-built trace store for sub-second queries over large trace volumes; deployment and Fleet capabilities that take it past observability into agent operations.
Where it costs you: billing is per seat plus trace volume, with a free Developer tier, a paid tier around thirty-nine dollars per seat, and separate meters for deployment runs, uptime, Fleet runs, and compute. Retention is the other lever, with extended retention priced roughly an order of magnitude above base. Self-hosting and single sign-on sit on the enterprise tier. For a single-step LLM feature it is more platform than the problem needs.
Everything else, by what it is actually good at
| Option | Strongest when | Tradeoff to price in |
|---|---|---|
| LangSmith | LangChain or LangGraph stack, or you want one vendor for the whole loop including CI gating and deployment | Trace and seat billing compounds; several separate meters; self-hosting is enterprise only |
| Langfuse | You want open source, MIT licensed, self-hostable, with tracing, prompt management, and evals in one tool | Acquired by ClickHouse in January 2026; open source commitment now rests with the new owner; self-hosting means running Postgres and ClickHouse yourself |
| Braintrust | Evaluation-first development where the eval loop drives the roadmap; strong independent with a serious customer list | Closed source, proprietary store, and a pricing step from free straight to a few hundred dollars a month; agent-trace depth lags the OTel-native tools |
| Arize Phoenix | OpenTelemetry-native self-hosting with no event caps and broad auto-instrumentation coverage | You own the infrastructure; the managed platform sits separately |
| Arize AX | Enterprise deployments joining agent evaluation to production monitoring and online evaluation | Reviewers describe it as stronger on observability than on experimentation and CI gating |
| Comet Opik | Apache 2.0 evaluation plus observability, especially where classical ML experiment tracking already lives in Comet | Smaller ecosystem than the leaders; independent, which cuts both ways |
| W&B Weave | Teams already standardized on Weights & Biases for model work | Now inside CoreWeave, with roadmap gravity toward the GPU cloud bundle |
| Galileo | High-volume online evaluation and guardrails in a large enterprise, especially a Splunk shop | Acquired by Cisco in 2026 and folding into the Splunk observability portfolio |
| Maxim AI | Pre-release simulation and multi-step agent testing, including testing through HTTP endpoints without touching source | Newer entrant; smaller community and integration surface |
| Laminar | Behavior clustering as the primary lens, with volume-based pricing instead of per-seat | Younger product; less enterprise procurement track record |
| Datadog or Splunk LLM observability | Agent telemetry must correlate with the application and infrastructure you already monitor | Agent-specific evaluation depth trails the specialists; pricing assumes you are already a platform customer |
| DIY: OpenTelemetry into your own store | Strict data residency, unusual volume economics, or a strong platform team that wants to own it outright | You build the eval UI, the annotation queue, and the clustering yourself, and you keep building them |

Evaluation libraries, which are a separate decision
You do not need a platform to start evaluating. These run as test suites in your repository and pair with any tracing backend:
- promptfoo for declarative test cases, red teaming, and CI integration. Acquired by OpenAI in 2026 with open source components continuing.
- DeepEval for agent-aware metrics including tool-call correctness at the span level.
- Ragas for retrieval-specific measures such as context precision, recall, and faithfulness.
- Inspect AI for structured evaluation harnesses with a strong safety and rigor lineage.
- DSPy with MIPROv2 or GEPA when you are ready to optimize rather than just measure.
A team with a good taxonomy, a hundred-case golden set in a repository, and promptfoo in CI is further along than a team with an expensive platform and no eval set. Buy the platform when trace volume, collaboration across non-engineers, and online evaluation on production traffic become the bottleneck, which for most serious deployments is somewhere between month two and month four.
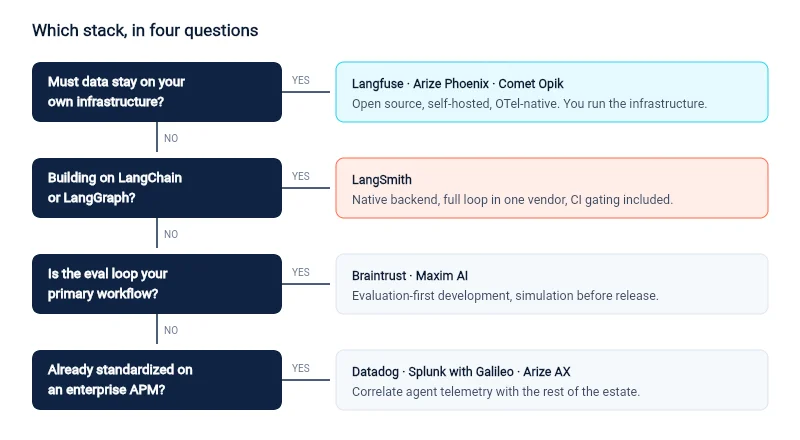
Four questions resolve most shortlists. Whichever branch you land on, instrument to OpenTelemetry so the branch remains a configuration decision.
The consolidation nobody priced into their roadmap
Between March 2025 and May 2026 this category went through the fastest consolidation any AI tooling sub-category has seen. Eight companies in fourteen months.
| Target | Buyer | When | What happened to the product |
|---|---|---|---|
| Weights & Biases, including Weave | CoreWeave | Mar 2025 | Still operating, bundled with GPU cloud |
| Velvet | Arize AI | Mar 2025 | Folded into the Arize platform |
| Humanloop | Anthropic | Aug 2025 | Team hired, product wound down |
| Statsig | OpenAI | Sep 2025 | Operating independently |
| Langfuse | ClickHouse | Jan 2026 | Continues as an open source product |
| Promptfoo | OpenAI | Mar 2026 | Technology integrating into OpenAI Frontier |
| Helicone | Mintlify | Mar 2026 | Standalone product in maintenance |
| Galileo | Cisco | May 2026 | Folding into the Splunk observability portfolio |
Three patterns sit behind those deals. Foundation labs buying the evaluation layer, because whoever owns the testing surface influences the model decision underneath it. Infrastructure vendors absorbing the application layer that runs on top of them. And larger dev-tool companies quietly absorbing smaller specialists they already depended on.
The practical consequence for a buyer is simple and it changes selection criteria. Acquisition outcome is now part of diligence. Ask what happens to this product if the company is bought in the next twelve months. The bigger deals have preserved products and accelerated roadmaps. The smaller ones have folded into the buyer’s strategy, with the standalone product going quiet.
Standardize at the instrumentation layer, choose a vendor at the analysis layer. If your agents emit OpenTelemetry GenAI spans, swapping backends is a change to an exporter endpoint. If your agents emit a vendor’s proprietary SDK format throughout the codebase, swapping backends is a quarter of engineering work you did not plan for. In a category consolidating this fast, that difference is the entire risk position.
What this costs, honestly
Most platforms in this category bill on trace or event volume, and the cost surprises come from three places that are all decided by engineering rather than procurement.
- Your definition of a trace. A trace is one execution of your application, which may contain dozens of model calls and tool calls. Instrumenting one trace per session versus one per conversation turn is the same traffic priced several times apart. Decide deliberately, then keep it consistent, because changing it later breaks every historical comparison you have.
- Evaluation runs are billable traffic. A nightly regression run over a couple of thousand examples generates tens of thousands of traces a month on its own. Once continuous evaluation is on, budget somewhere in the range of one and a half to two and a half times baseline volume.
- Retention. Extended retention typically prices at roughly nine to ten times base. Apply it to the compliance-relevant slice, not to everything.
None of this makes the category expensive relative to what it prevents. It does mean that the number in your first month of production will not be the number in your sixth unless somebody models it up front.
The six mistakes we see most
- Buying the platform before building the taxonomy. A tool cannot tell you that unit-of-measure mismatches matter to your business. Read a hundred traces first.
- One aggregate quality score. It moves, nobody knows why, and it makes every conversation vague. Track the named failure modes separately.
- An uncalibrated judge. If you have never measured your judge against human labels, you do not know what your eval score means.
- Changing three things at once. A new prompt, a new model, and a re-indexed corpus in one release means the result is uninterpretable whichever way it goes.
- Evaluating the final answer only. Most agent failures happen mid-trajectory. Score the steps.
- Treating guardrails as improvement. Blocking a bad output is a control. The agent is still producing it. Guardrails buy time to fix the cause, they are not the fix.
How we run this at Bitcot
Continuous improvement is a phase of our AI Development Lifecycle, not a post-launch add-on, and it is scoped into the build from the first sprint. In practice that means three things are true at go-live rather than six months after it.
Instrumentation is written against OpenTelemetry GenAI conventions from the first agent loop, with content capture configured per span type and redaction in the pipeline, which matters when the traces contain PHI or contract terms. The evaluation set exists before the launch, seeded from the failure modes found during pilot traffic, and it lives in the repository with a CI gate attached. And the failure taxonomy is a shared artifact between engineering and the business owner, which is what turns a quality conversation into a prioritization conversation.
This is also why we quote six weeks rather than four for agentic builds that combine multi-tenancy with write actions. The loop described above is the difference between an agent that demos well and one that is still trusted in month four, and it is real engineering work, not configuration.
Back to the distributor. The taxonomy took one afternoon. The evaluation set, seventy-four cases drawn from real purchase orders across the seven named failure modes, took a week. Six of the seven modes were resolved on rungs one through three of the ladder. The seventh, confident list pricing after a tool failure, was a topology fix: the pricing step became a hard dependency that fails the run rather than a soft input the model could route around. Approval-without-edit rate is now a number the operations lead reads weekly, per failure mode, and every release moves it or does not ship.
This scenario is a composite drawn from multiple engagements, with details changed. It is used to illustrate the workflow rather than to describe a single client.

The one thing to take away
The tool choice matters less than the loop. A team running all six stages with promptfoo and a self-hosted Phoenix instance will out-improve a team running two stages on the most expensive platform in the category, every time. LangSmith earns its place at the top of the shortlist because it covers the most of that loop in one product, and that is a real advantage when your team is small and your surface area is growing. It is an advantage over the alternatives, not over the discipline.
Pick the stage you are weakest on. For most teams reading this, it is stage three, and the fix costs an afternoon and a spreadsheet.
Frequently Asked Questions
What is continuous improvement in an agentic system?
Continuous improvement in an agentic system is a closed loop that turns production behavior into measured quality changes. You instrument every agent run as a trace, sample and triage failures into a named taxonomy, convert those failures into evaluation cases, change one layer of the system, and gate the release on an evaluation score rather than a demo. Without the evaluation step, you have monitoring, not improvement.
Is LangSmith the best tool for agent observability and evaluation?
LangSmith is the strongest default if you build on LangChain or LangGraph, because it is the native tracing and evaluation backend and it covers the full loop: tracing, datasets, offline experiments, online LLM-as-judge scoring, human annotation queues, and CI gating through pytest and Vitest. It is framework agnostic and accepts OpenTelemetry, so it works outside LangChain too. It is not automatically the best choice for every team. Cost scales with trace volume and seats, and open source alternatives such as Langfuse, Arize Phoenix, and Comet Opik are better fits for strict data residency or self-hosting requirements.
What are the main alternatives to LangSmith in 2026?
The credible alternatives fall into groups. Open source and self-hostable: Langfuse, Arize Phoenix, and Comet Opik. Evaluation-first commercial platforms: Braintrust and Maxim AI. Enterprise observability platforms: Arize AX, Galileo inside Cisco’s Splunk portfolio, Fiddler, and Datadog LLM Observability. Standalone evaluation libraries you run yourself: promptfoo, DeepEval, Ragas, and Inspect AI. Finally, a do-it-yourself stack of OpenTelemetry instrumentation into your own ClickHouse and Grafana.
Should I use OpenTelemetry for agent tracing?
Yes, for the instrumentation layer. The OpenTelemetry GenAI semantic conventions model a whole agent run as a span tree with operations such as create_agent, invoke_agent, execute_tool, retrieval, and plan, and MCP tool calls now share the same vocabulary. The conventions are still marked Development rather than Stable, so pin your schema version, use the stability opt-in for dual emission during transitions, and expect attribute names at the edges to move. Instrumenting to the standard means a vendor change is a configuration change rather than a rewrite.
What is the difference between offline and online evaluation for agents?
Offline evaluation runs a fixed dataset of test cases against a candidate version before release, producing a comparable score you can gate a pull request on. Online evaluation scores a sample of real production traffic after release using cheap judges, heuristics, or human review, which catches drift and inputs your dataset never contained. Production teams need both: offline evaluation prevents regressions you already know about, online evaluation finds the failures you have not named yet.
How much does agent observability cost at production volume?
Most platforms bill on trace or event volume, and the single biggest cost decision is what you define as a trace. Instrumenting one trace per session versus one per conversation turn can change your bill by several times for identical traffic. Evaluation runs also generate billable traces, so budget roughly one and a half to two and a half times your baseline volume once continuous evaluation is on. Extended retention is typically the other multiplier, often around nine to ten times the base rate, so keep long retention for the compliance-relevant slice only.
Can prompt optimization be automated?
Partly. Reflective optimizers such as GEPA, presented at ICLR 2026 and built on the DSPy framework, run your system on a minibatch, read the execution traces and textual feedback, and evolve prompt candidates along a Pareto frontier. Reported results include outperforming the GRPO reinforcement learning baseline by up to twenty percent while using far fewer rollouts. The catch is that an optimizer only maximizes the metric you give it, so automated optimization is only as good as the evaluation set and feedback function behind it. Build the evaluation set first.
What should I change first when an agent underperforms?
Work up an intervention ladder from cheapest and most reversible to most expensive. Start with instructions and context, then tool descriptions and argument schemas, then retrieval configuration, then model routing, then orchestration topology such as splitting one overloaded agent into bounded focused areas, then automated prompt optimization, and only then fine-tuning or reinforcement learning on traces. Most production quality problems we see are resolved in the first three rungs, and teams that jump straight to fine-tuning usually cannot tell whether it helped.