- No React Native library manages D-pad focus for a WebView-based map.
- The focus bridge, not the map itself, was the hard engineering problem.
- One Expo codebase shipped to Android TV, Apple TV, web, and mobile.
- Clustering and lazy loading kept the map at 60fps on TV hardware.
- A boardroom TV app is worth building only if the room actually uses it.
Introduction
Every React Native mapping library on the market assumes a touchscreen or a mouse. None of them assume a D-pad. That gap does not show up until you try to make a Leaflet map respond to the up, down, left, and right arrows of a television remote, and discover that nothing in the ecosystem does it for you.
The television is also no longer a niche target. Pew Research Center tracking on connected device ownership shows internet-connected televisions are now a mainstream presence in American households, which is exactly the boardroom and operations-room hardware this PoC targets rather than a consumer edge case.
We built a proof of concept, in the same spirit as the React Native and Expo work we do for mobile clients, to find out whether a single codebase could deliver a genuinely usable GIS mapping and analytics experience on Android TV, Apple TV, a web browser, and mobile, without four separate teams and four separate rebuilds. The interesting part of that build was never the map data. It was bridging a map designed for a cursor to a remote control that has neither.
This is a PoC, not a shipped client engagement, and it is worth saying so plainly. What follows is the architecture we landed on, the specific problem that made it hard, and an honest view on when a boardroom television is actually worth building for.
What Is a Cross-Platform TV App?
A cross-platform TV app is software that runs on television operating systems such as Android TV and tvOS from the same codebase used for web and mobile, sharing business logic while adapting input handling and layout to a remote-control environment. The defining constraint is not the screen size. Larger screens are trivial to design for. The constraint is the input method: no touch, no cursor, only directional navigation and a small number of buttons.
That constraint is why most “TV apps” are really mobile apps stretched wider, and why a genuinely TV-native experience requires purpose-built focus handling underneath a shared logic layer.
The Real Problem: Bridging a DOM-Based Map to a D-pad
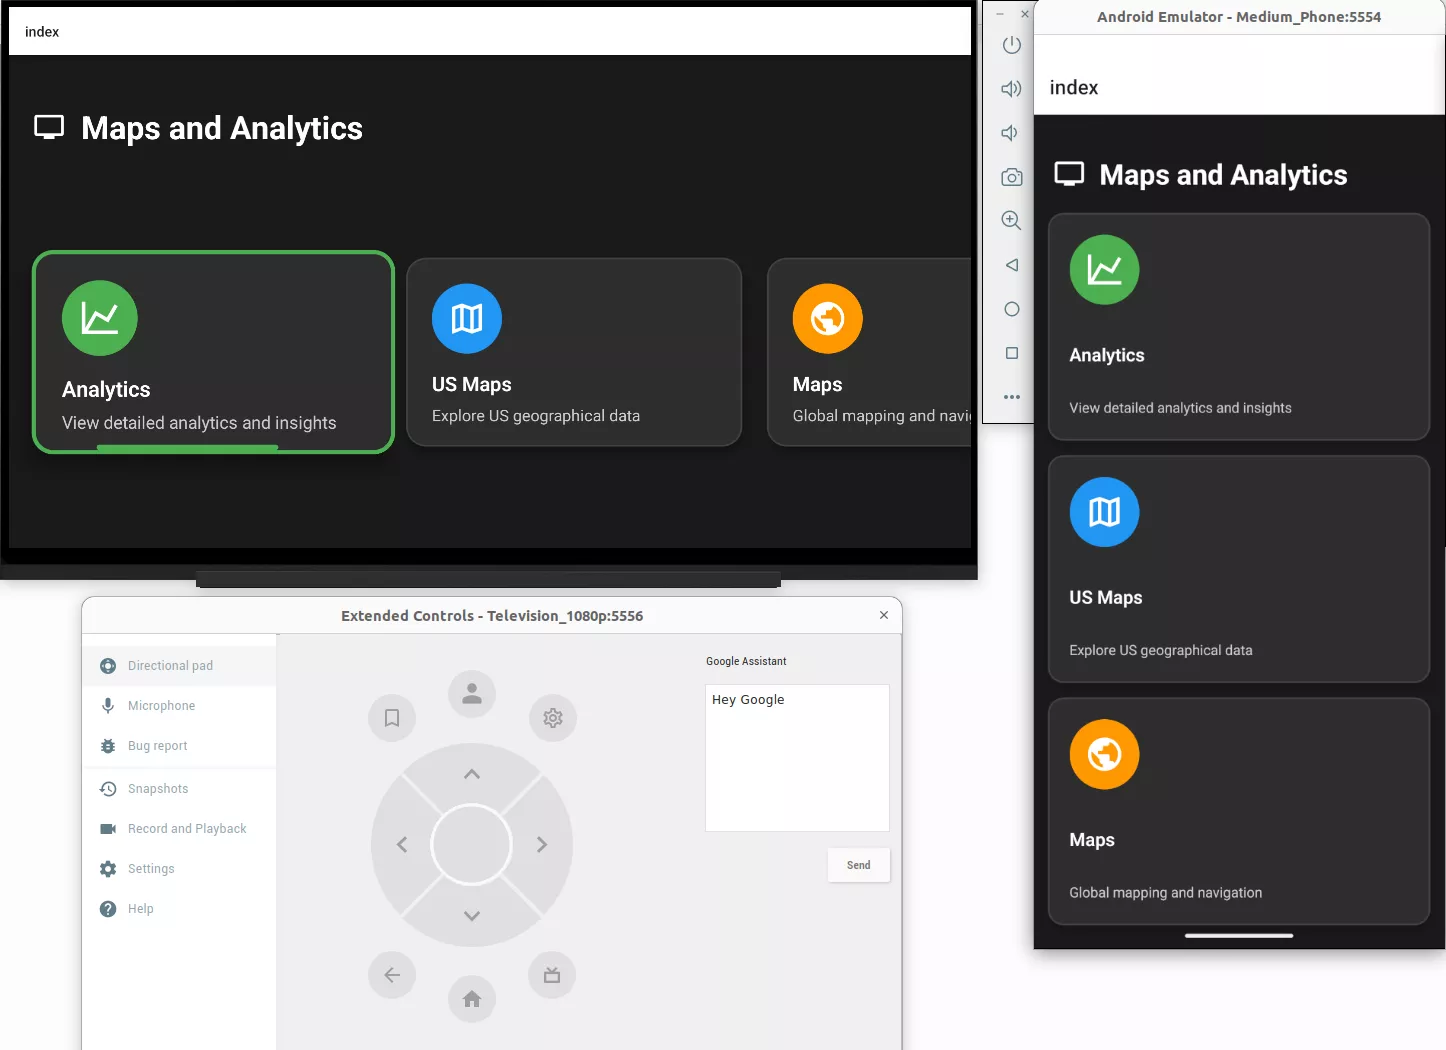
Rendering a professional-grade map on TV hardware effectively means running Leaflet.js, because rebuilding a mapping engine natively for this scope was not realistic. Leaflet renders inside a browser DOM. A DOM has no concept of D-pad focus. React Native’s own focus system, meanwhile, has no concept of what is happening inside a WebView it does not control.
Those two systems do not talk to each other by default. We built the bridge ourselves: a focus layer outside the WebView that tracks D-pad input and translates directional presses into pan and zoom commands sent into Leaflet’s own coordinate system, then reads Leaflet’s state back out to keep the two in sync. This is the piece that determined whether the whole PoC worked, and it is the piece no off-the-shelf library provides.
Why this matters more than the data sources
Integrating OpenStreetMap and Esri’s REST API is real work, but it is well-trodden ground with mature documentation on both sides. OpenStreetMap’s own data license and Esri’s REST API documentation cover the integration mechanics thoroughly. The focus bridge has no equivalent documentation anywhere, because almost nobody has needed to build a data-dense, DOM-rendered map for a D-pad before.
Detecting TV Hardware at Launch
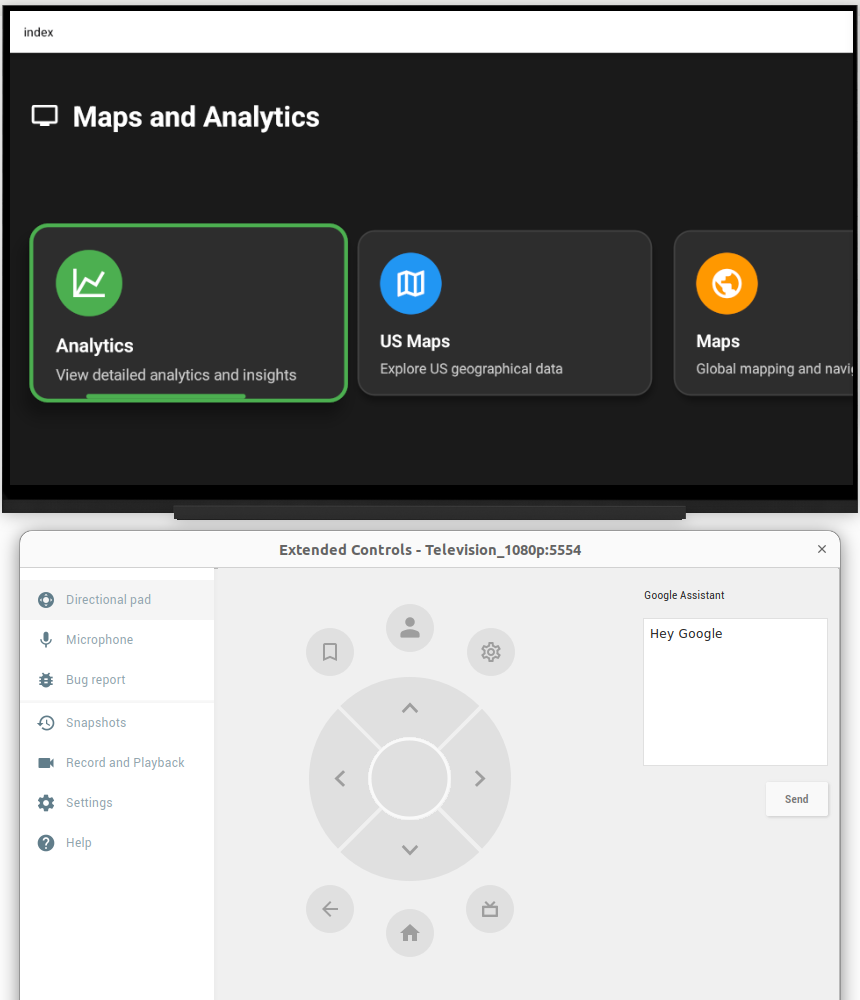
A single codebase still has to know which device it is running on before it renders a single pixel. We used the EXPO_TV=1 build flag to trigger a TV-specific initialization path at launch. Detecting the environment early means the app can switch to high-contrast UI elements and the D-pad focus handlers before the first frame paints, rather than trying to retrofit remote-control support onto a touch-first layout.
How Do You Handle Dense GIS Data on TV Hardware?
Layer it, cluster it, and only render what is currently on screen. Those three moves are what keep a data-heavy map usable on hardware that is typically less powerful than a mid-range phone.
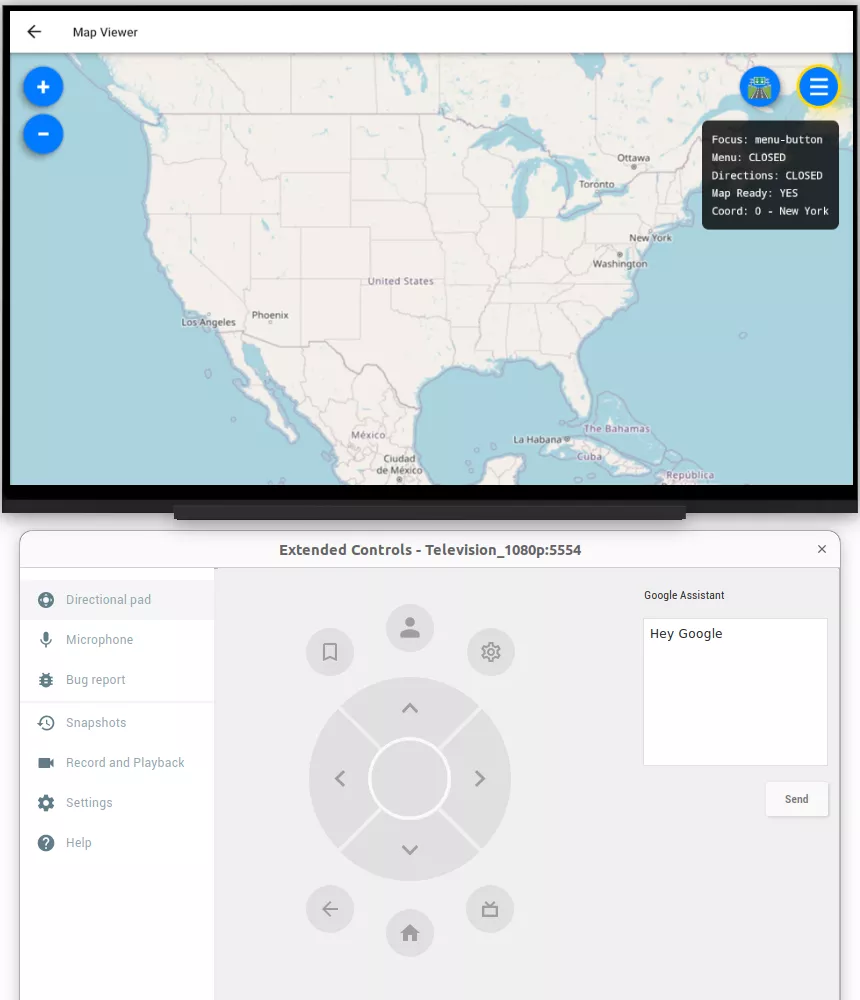
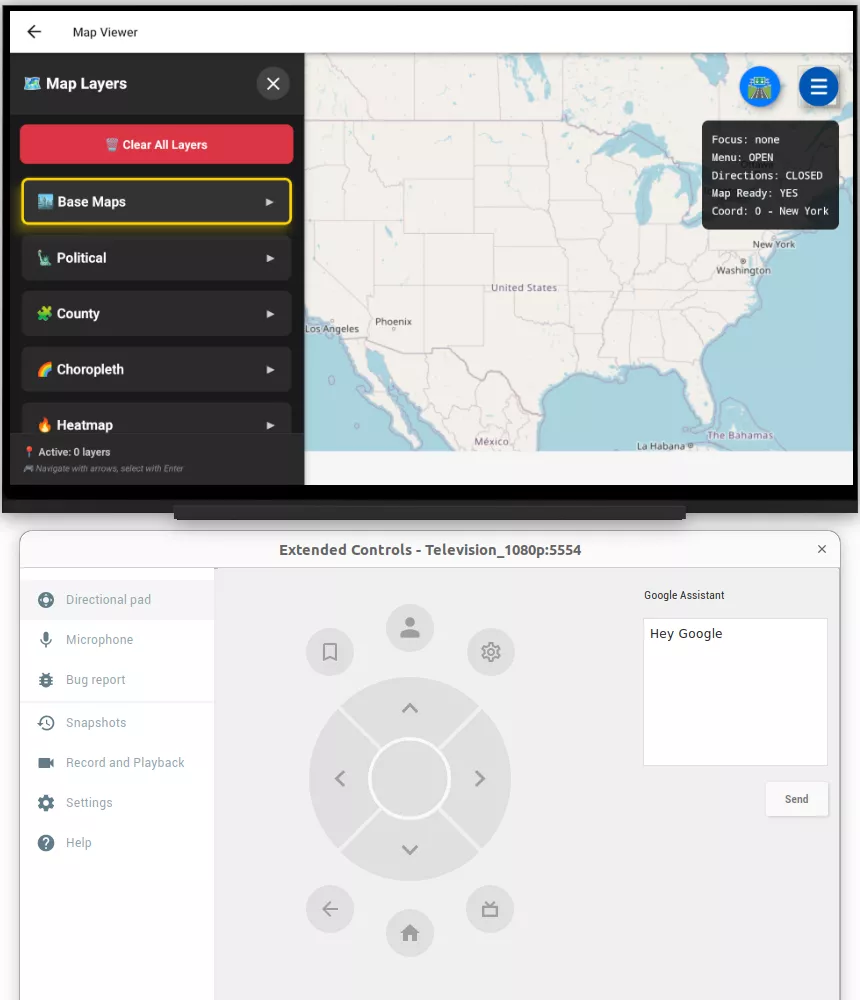
Layer toggling against live data
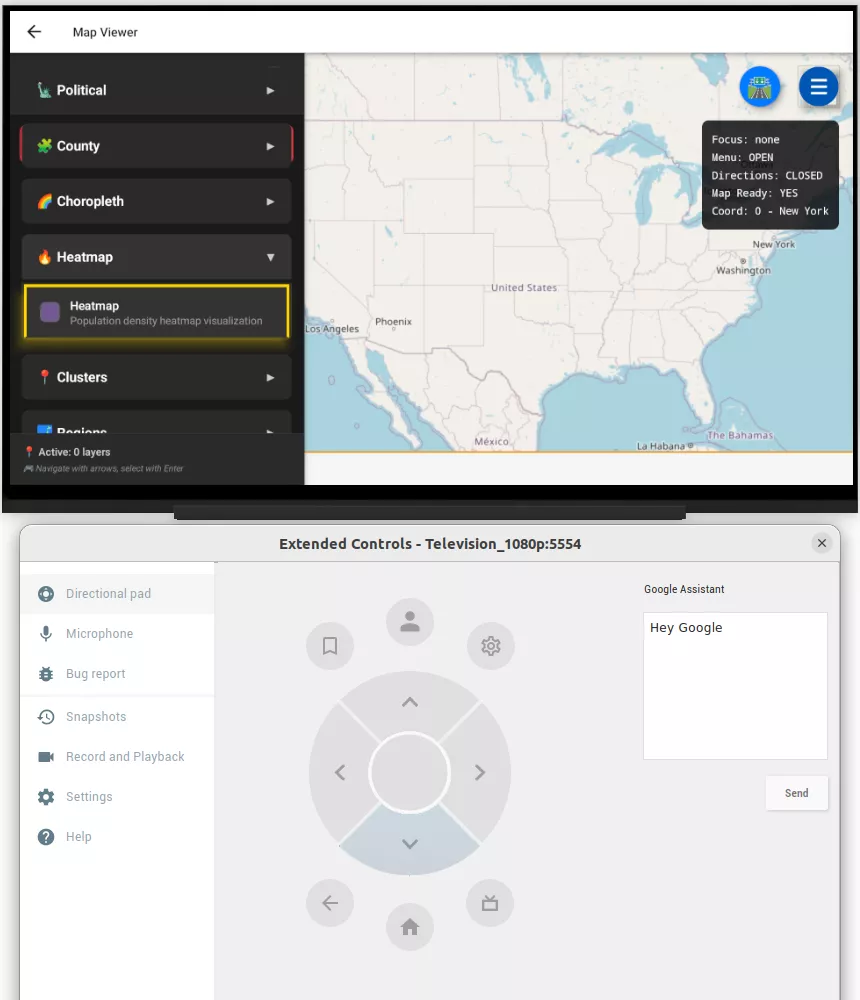
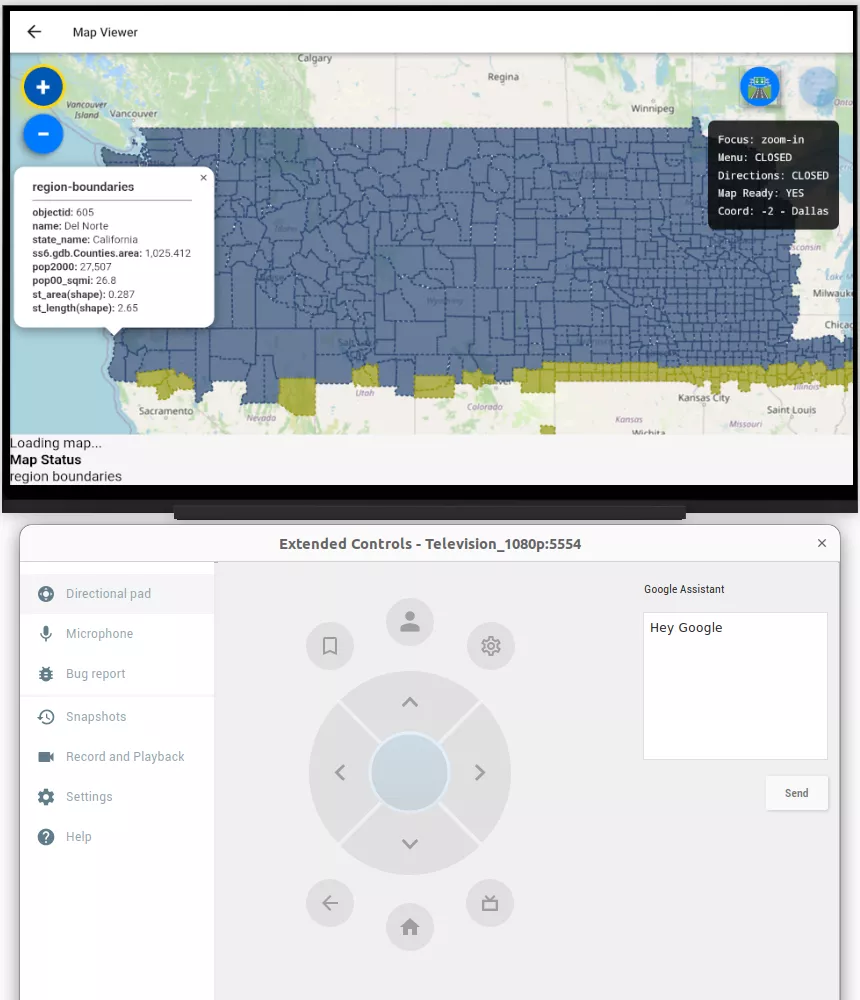
Each thematic layer, demographics, infrastructure, environmental hazards, fetches from Esri REST endpoints on demand rather than bundling static data, so the boardroom view stays synchronized with whatever changed in the cloud most recently.
City clustering and smart zoom
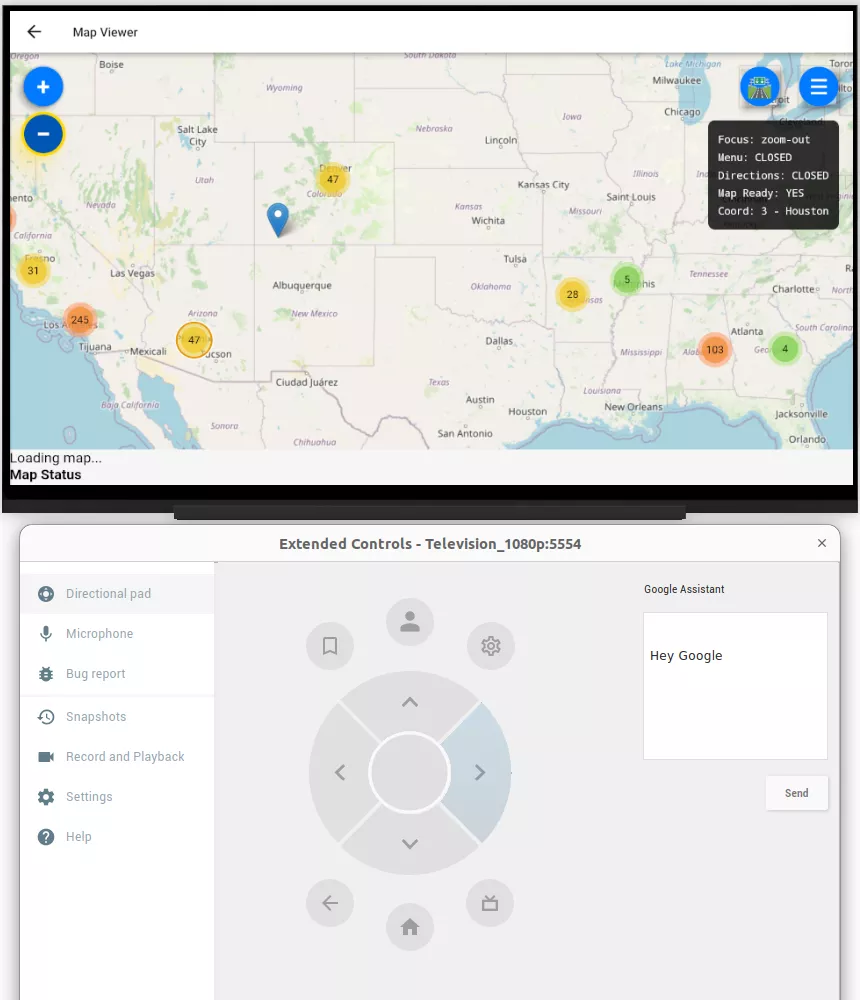
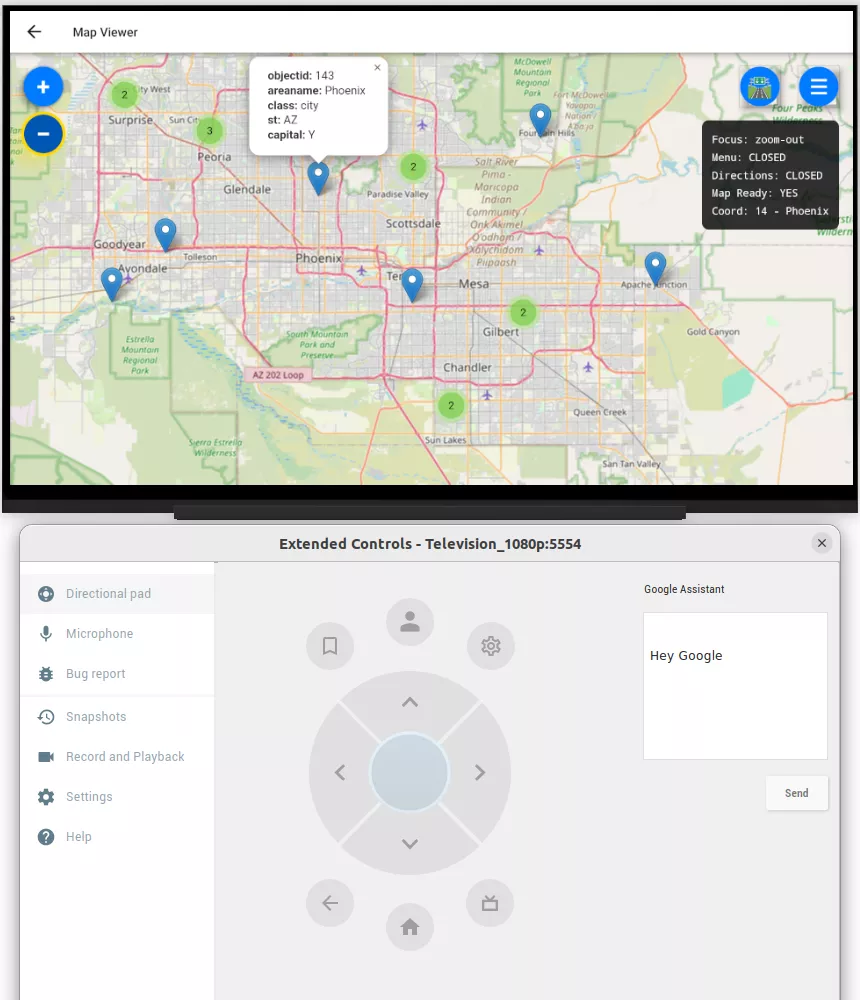
Thousands of individual markers on a 4K display read as noise rather than information. Clustering groups nearby points by zoom level and expands them only when a user drills in, which is a standard GIS pattern applied here specifically because ten feet of viewing distance makes clutter worse than it would be on a laptop screen.
Lazy loading to hold frame rate
The app only processes data for the region currently in view. Off-screen data is not evaluated until it enters the viewport. That single decision is what kept map panning at a smooth frame rate on hardware that would otherwise choke trying to render a full national dataset at once.
Logistics: Route Visualization on the Big Screen
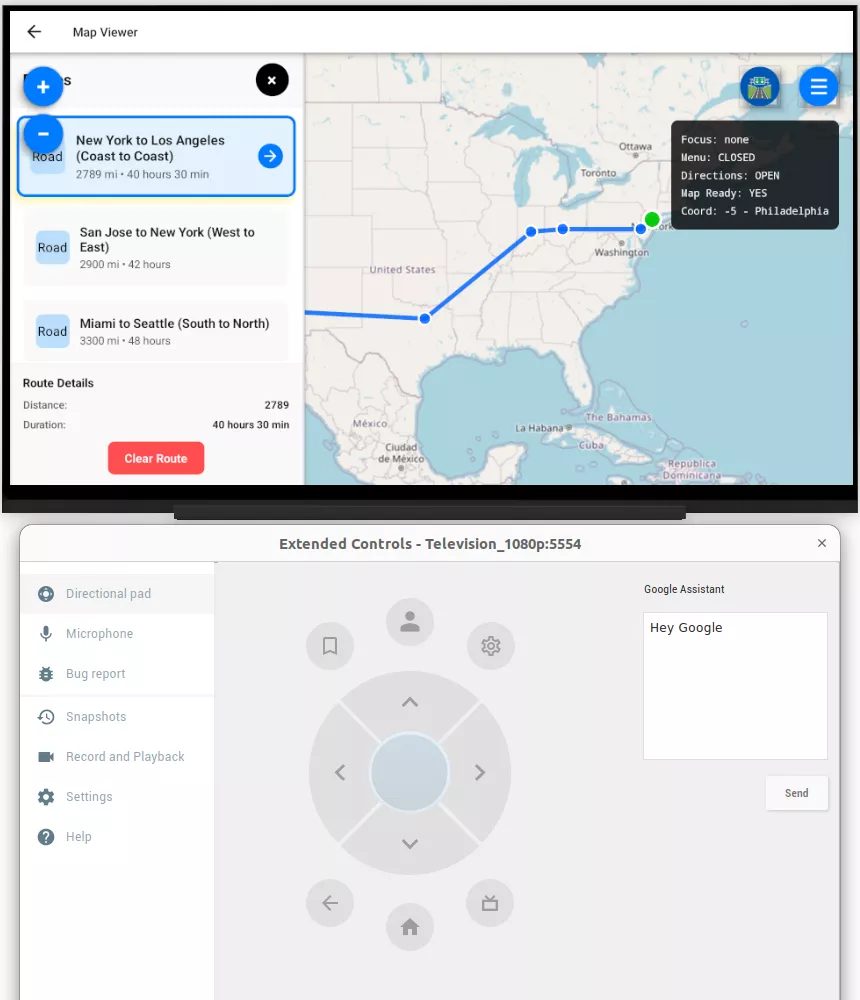
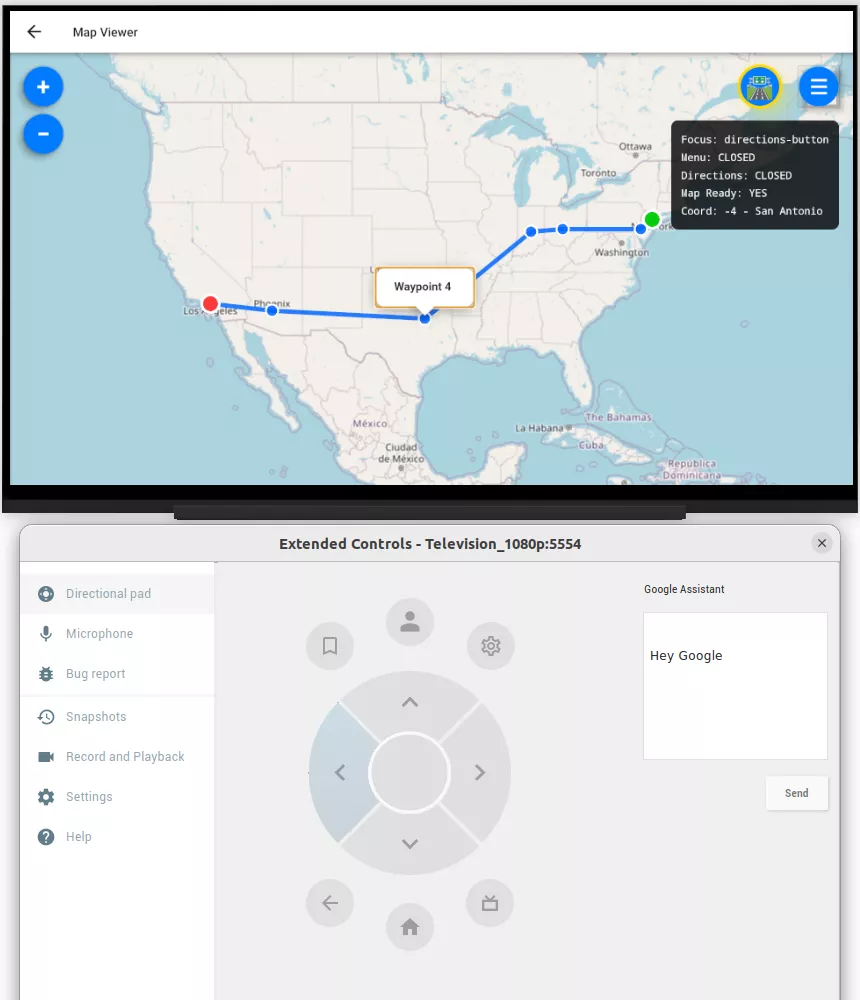
For a logistics use case, we added predefined route visualization with waypoints, distance, and estimated travel time, plus a turn-by-turn panel a user can step through with the D-pad alone. This is the kind of feature that only makes sense once the underlying focus bridge exists. Building it as a one-off would not have been worth the engineering cost; building it on top of an already-solved focus system took a fraction of the time.
Can You Build a Real-Time Weather Layer Into a TV Map?
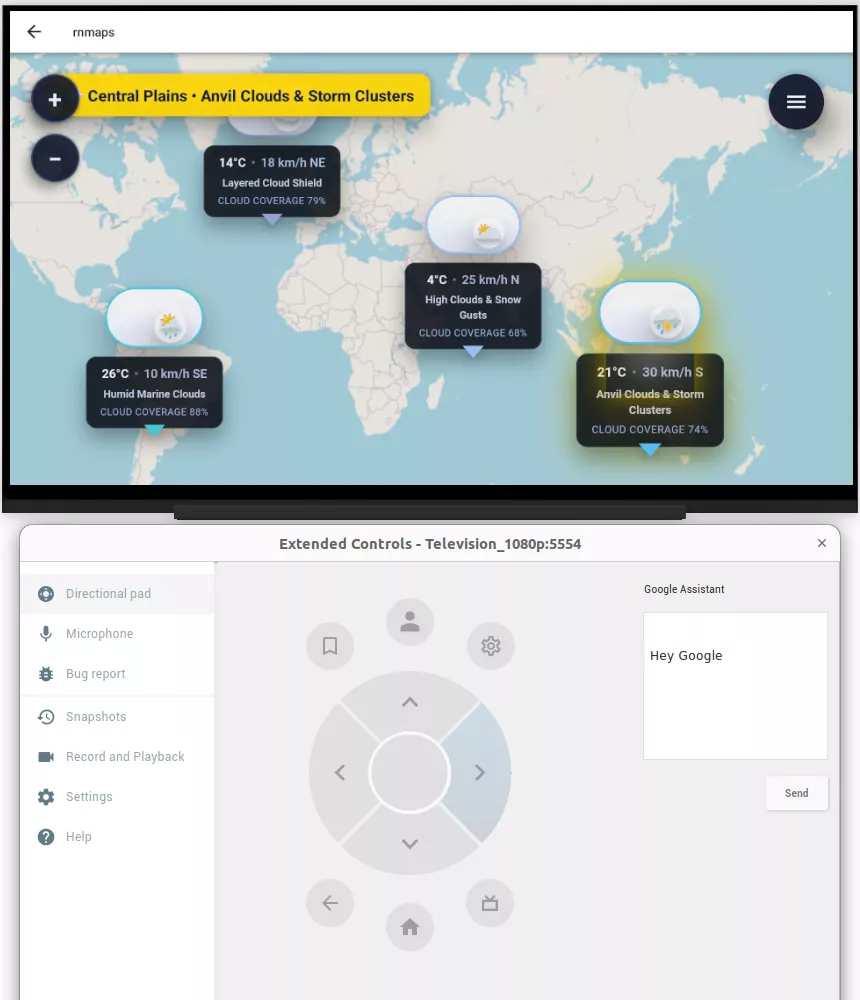
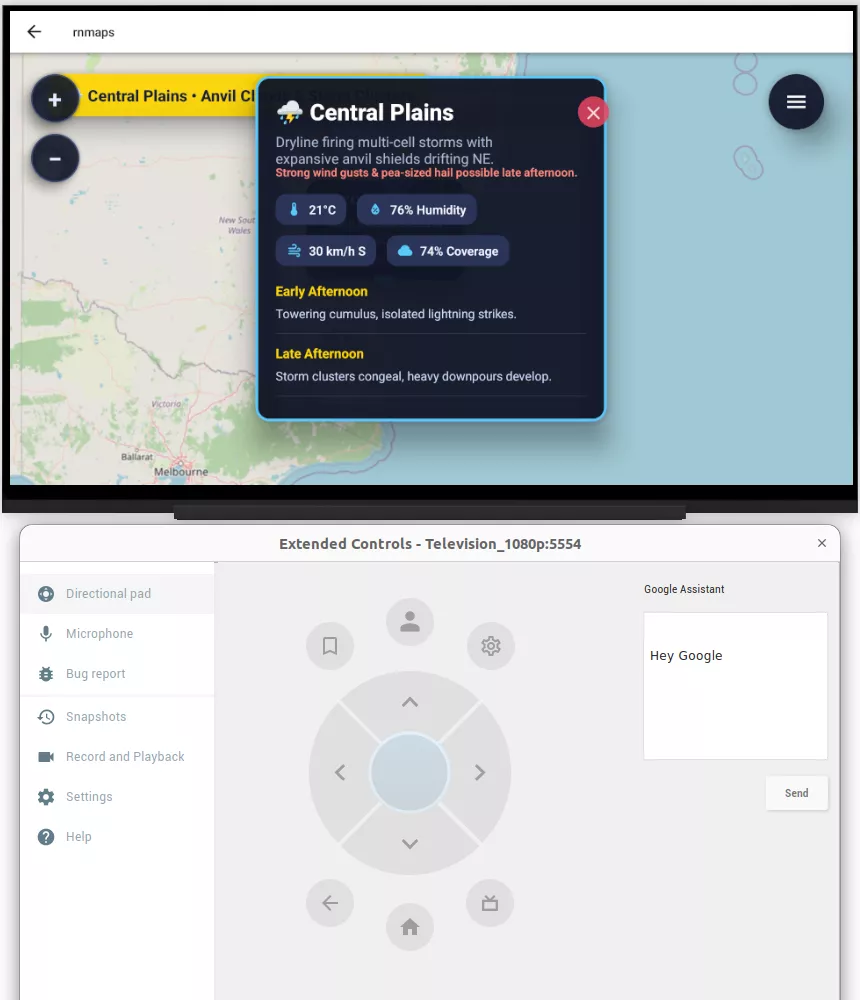
Yes, and the mechanism is the same as any other thematic layer: live radar and storm tracking fetch and render through the same layer-toggle system used for demographics and hazards. Nothing about weather data required special-case handling once the underlying layer architecture existed, which is a reasonable sign the architecture was designed correctly rather than built around one data type.
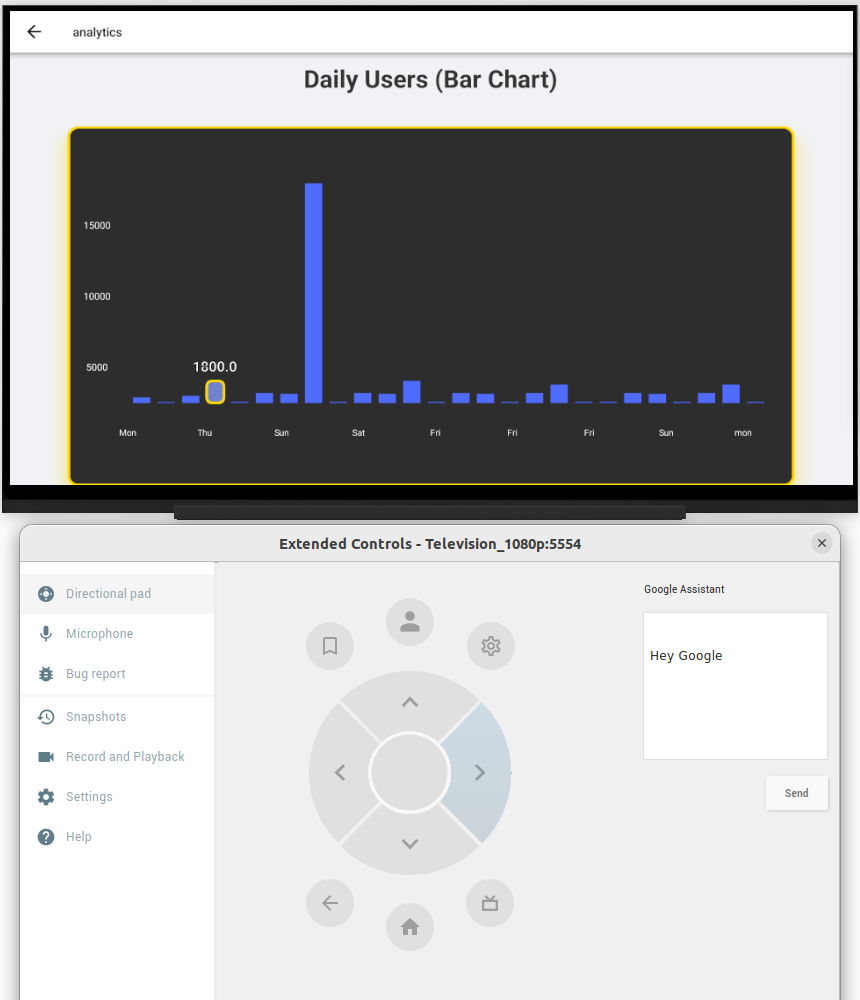
Most React Native charting libraries assume the same input model as most mapping libraries: a finger or a mouse. Building a chart a user can navigate with a D-pad meant rebuilding focus handling at the level of individual data points, not just the container the chart sits in. A bar chart with twelve bars needs twelve individually focusable elements, each one aware of its neighbors, so pressing right moves logically from bar to bar rather than losing focus entirely.
We built this focus layer once, then applied it across a full library of chart types so the dashboard could represent different kinds of data without breaking the input model each time.
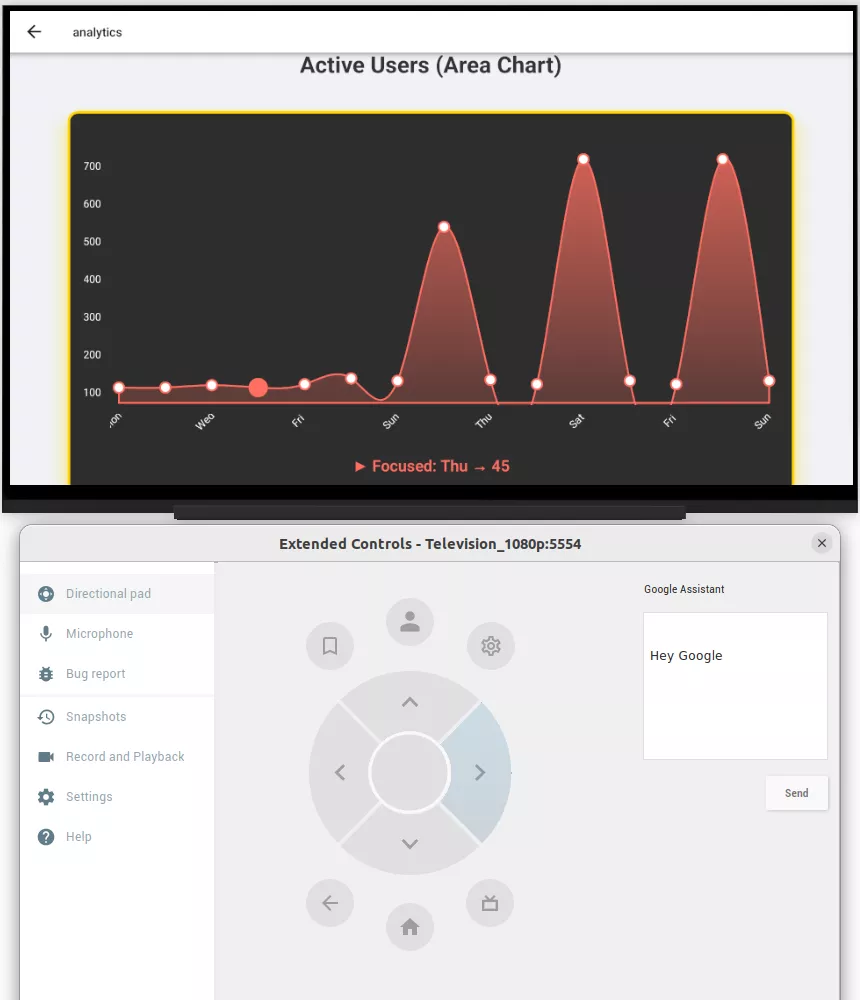
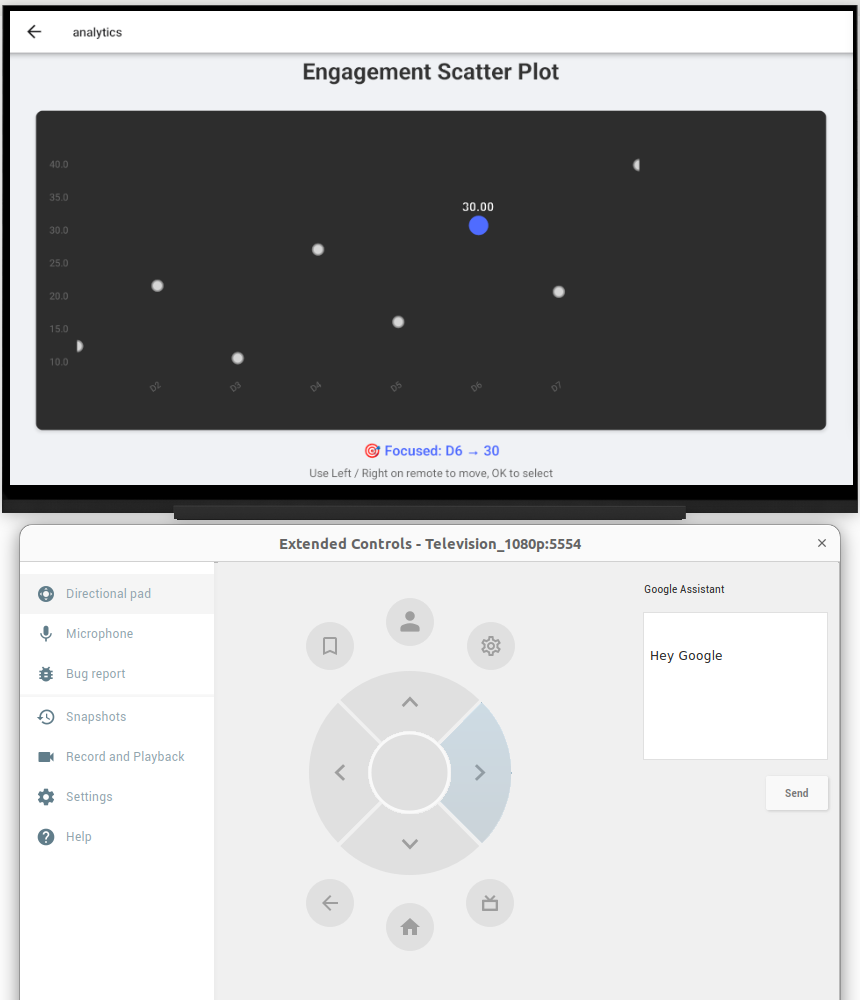
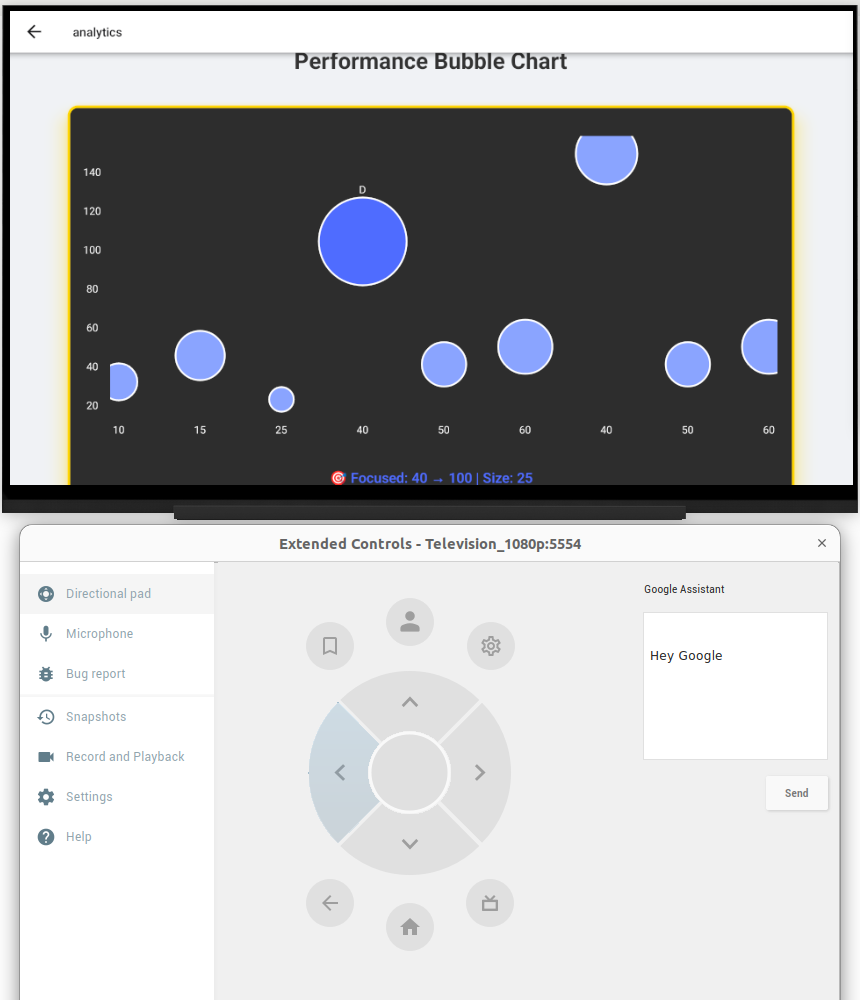
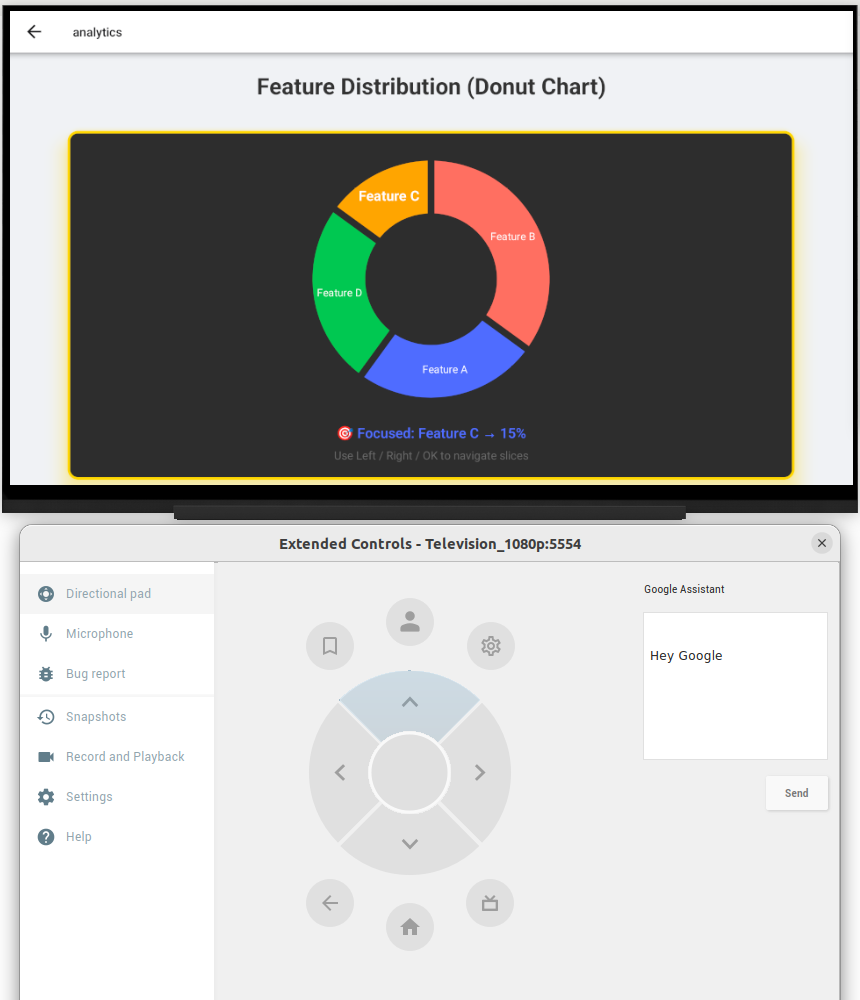
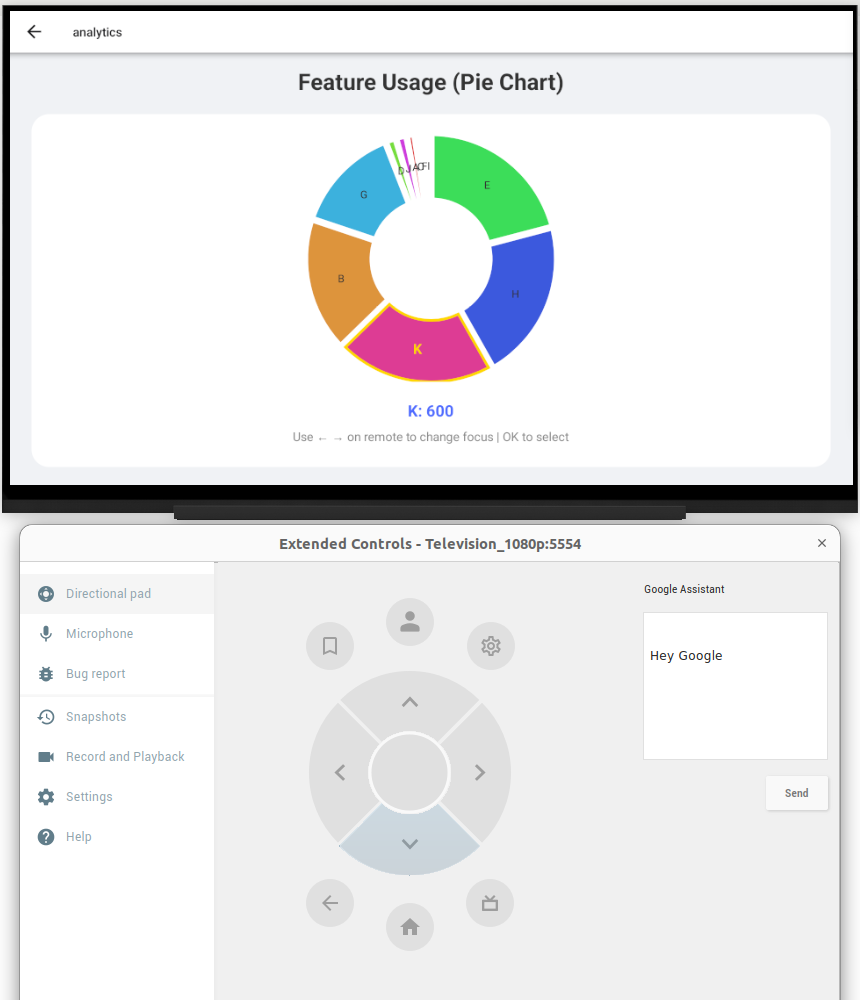
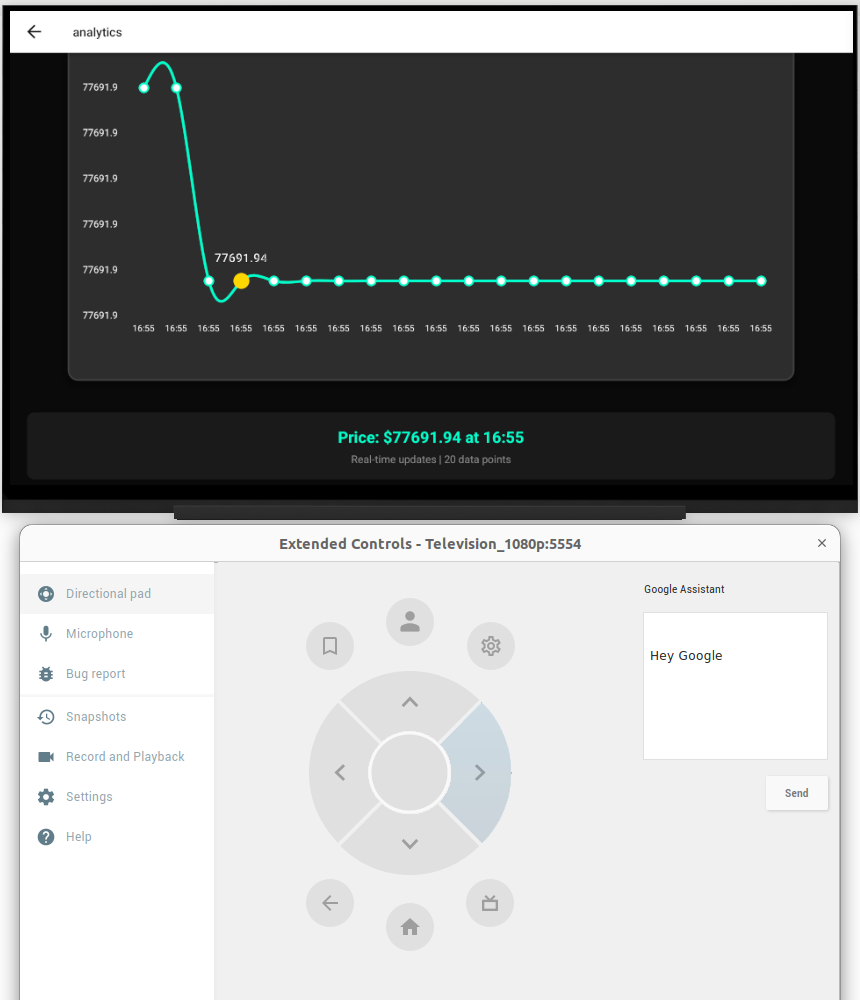
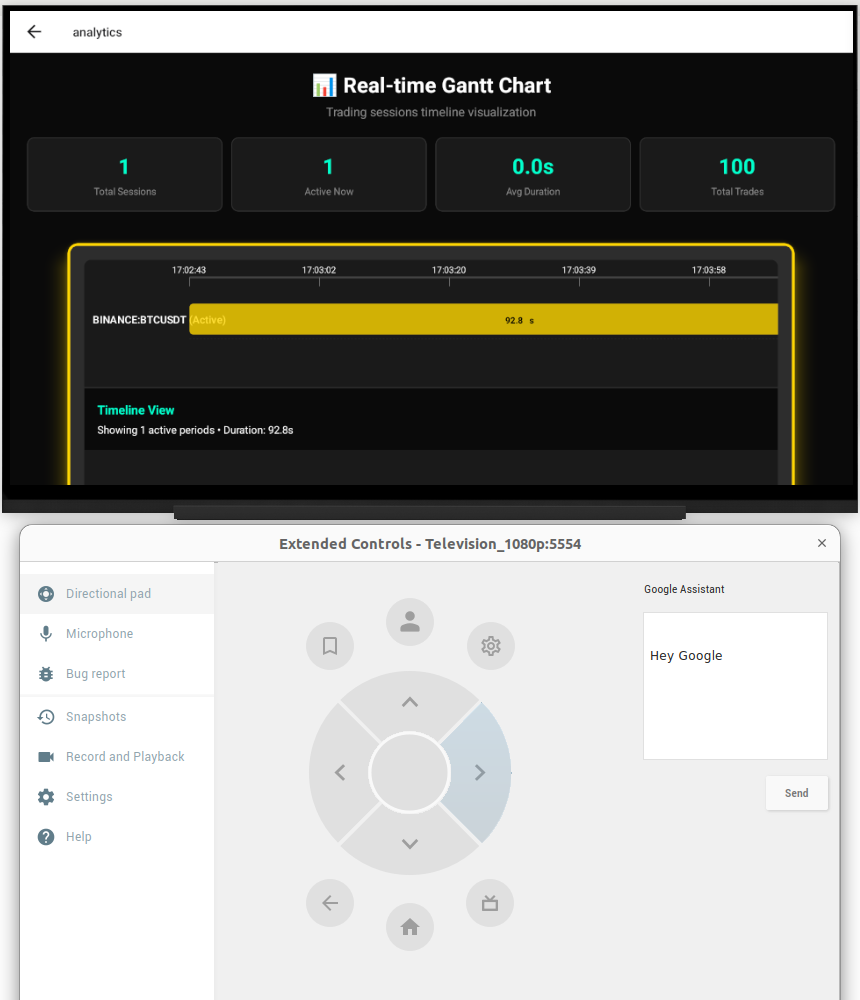
Every chart above rebinds its data live: switching a map layer or zooming into a region updates the connected charts without a page reload, using standard React hooks for state rather than anything TV-specific. The TV-specific work was entirely in the focus layer, not the data binding.
Fullscreen Immersion and Context Panels
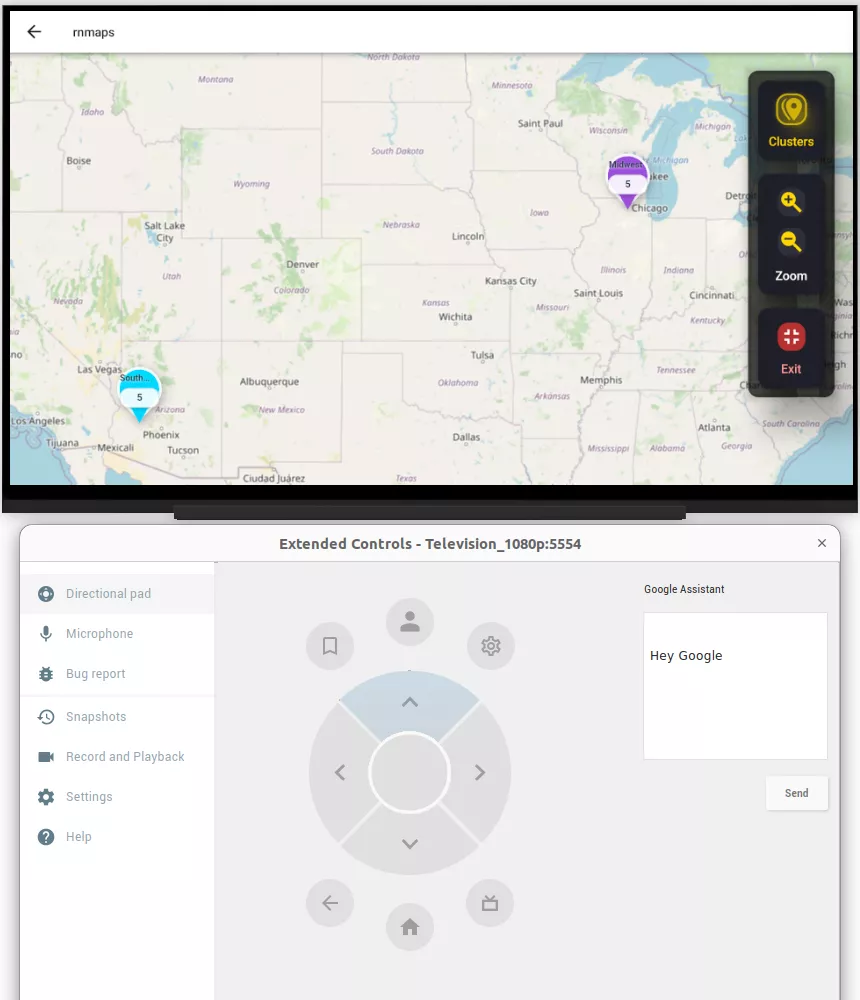
A fullscreen mode removes chrome for pure map exploration, and a context-aware info panel surfaces deep-dive statistics on a selected region without covering the map entirely. Neither is a complex feature on its own. Both depend on the same focus bridge to make entering and exiting them navigable without a remote user getting stuck, which was the actual engineering dependency worth noting.
Should Your Organization Build a TV App at All?
Only if the room genuinely uses the television as a working surface, not as decoration. That is a narrower group than most pitches for this category assume.
It is a strong fit for a logistics team that already gathers around a boardroom screen daily, an emergency operations center tracking live conditions, or an educational setting presenting demographic or geographic data to a room. It is a weak fit if the real goal is a slide deck with better graphics, or if nobody currently uses the TV for anything beyond video calls. Building a genuinely interactive TV experience for a device that gets turned on twice a quarter is a cost nobody recovers.
Accessibility is worth naming directly here. The W3C’s keyboard accessibility guidance requires that all functionality be operable through a keyboard interface without requiring specific timing, which is functionally the same standard a D-pad has to meet. Building genuine focus management, rather than a touch interface that technically also responds to arrow keys, is what that standard actually asks for.

The Technology Stack
| Category | Technology |
| Core framework | React Native (Expo) with React Native TVOS |
| Navigation | Expo Router with a custom D-pad focus engine |
| Mapping engine | Leaflet.js, the Esri Leaflet plugin, and OpenStreetMap tiles |
| Data visualization | React Native SVG Charts with custom focusable components |
| State management | React hooks: useState, useEffect, useMemo |
| Build and deploy | Expo EAS with the TV config plugin (@react-native-tvos/config-tv) |
| Platform reach | Android TV, Apple TV, web, and mobile from one codebase |
What This PoC Demonstrated
One codebase reached four platforms, Android TV, Apple TV, web, and mobile, without four separate implementations of the hard part. The D-pad focus bridge, built once, carried through the map, the route visualization, the chart library, and the fullscreen mode without needing to be solved again for each feature.
That is the actual outcome worth taking from this build. Not that a map can run on a television, which was never seriously in question, but that the input problem which makes TV development slow and expensive can be solved once and reused, provided someone builds it deliberately rather than discovering it feature by feature. The same discipline applies to any smart TV app development effort, regardless of the specific data domain.
We have applied the same cross-platform thinking outside React Native as well, including a Roku TV build on BrightScript and AWS for content streaming and separate work on Google TV and Roku app environments, where the constraints differ but the underlying question, how do you make a remote control feel native rather than tolerated, is the same one.
Conclusion
The interesting engineering problem in a TV app is almost never the feature you set out to build. It is the input model underneath it. A map, a chart, a route planner, none of these are hard on their own. Making any of them respond correctly to a D-pad, with no library to lean on, is the actual work.
If your organization has a genuine boardroom or operations-center use case for this kind of tool, the question worth asking a vendor is not whether they can put your data on a TV. It is whether they have ever solved focus management for a non-native interface, because that is the part that determines whether the result feels built for the room or merely displayed in it.
The mapping and analytics layers in this PoC also generalize to other data sources. Connecting a boardroom dashboard to an internal CRM, ERP, or data warehouse is the same API integration problem regardless of whether the screen it renders on is a laptop or a television, and teams evaluating React Native app development for either surface are solving a closely related set of problems.
Frequently Asked Questions
What is a cross-platform TV app?
A cross-platform TV app is software that runs on television operating systems such as Android TV and tvOS from the same codebase used for web and mobile. The defining engineering challenge is not screen size but input method, since a television has no touch or cursor input and relies entirely on directional D-pad navigation.
How do you build a React Native app for both Apple TV and Android TV?
Using Expo with the React Native TVOS fork and the TV config plugin, which sets up the build targets for both platforms from one project. The framework handles the platform-specific build output, but D-pad focus management for anything beyond basic navigation, such as a map or a chart, still has to be built manually, since no standard library provides it.
What is D-pad focus navigation and why is it hard to implement?
D-pad focus navigation is the system that determines which on-screen element is currently selected and how pressing an arrow key moves that selection. It is hard because most UI libraries, including mapping and charting libraries, are built assuming touch or mouse input and have no concept of directional focus between elements, so that logic has to be built from scratch for each interactive component.
Can a web-based map like Leaflet run inside a TV app?
Yes, by rendering it inside a WebView, but the map itself has no awareness of D-pad input since it is designed for a browser’s DOM. Making it usable on TV requires a separate focus bridge that translates D-pad presses into the map’s own pan and zoom commands, which was the central engineering problem in this build.
Should an enterprise build a boardroom TV app at all?
Only if the room already uses the television as a working surface rather than a display for slides. It is a strong fit for logistics teams, operations centers, or educational settings that reference live data regularly, and a weak fit for a room where the TV is used a few times a quarter, since the engineering cost of a genuinely interactive build is not recovered by occasional use.